Model 831 Manual Time History Display 11-13
Except for the bandwidth, these displays are identical, so we
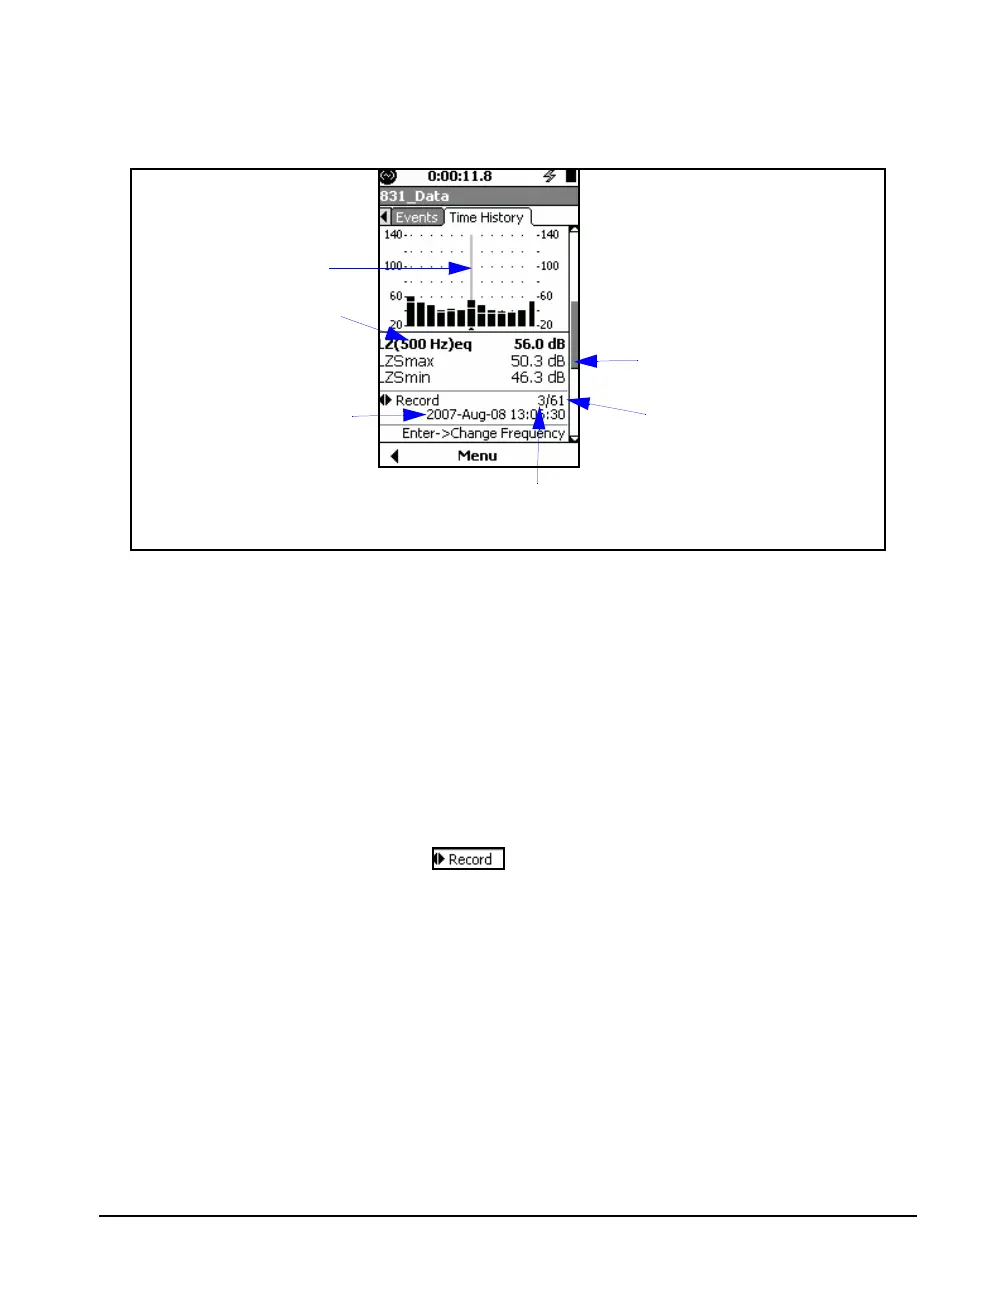
will use a 1/1octave spectrum as an example.
FIGURE 11-10 Time History Display: Spectra Metrics, Section 2 and 3
Left/Right Arrow Keys
For the display shown in FIGURE 11-10, the 4 and 6 keys
have dual roles as listed below. Press
5 to toggle between
them:
• Change Record:
• Change Frequency
At any time, the role of the left and right arrow keys, as well
as the means to change it, are indicated by the icon
in the lower portion of the display, as shown in FIGURE 11-
11.
Cursor Position
Frequency at
Cursor Position
Leq, Lmax and Lmin
Values at Cursor Position
Record Number at
Cursor Position
Total Number of Records
Measured
Data and time at
cursor position