11-12 Time History Display Model 831 Manual
appeared in the list when selected, as described in "Select
Time History Metrics” on page 11-6.
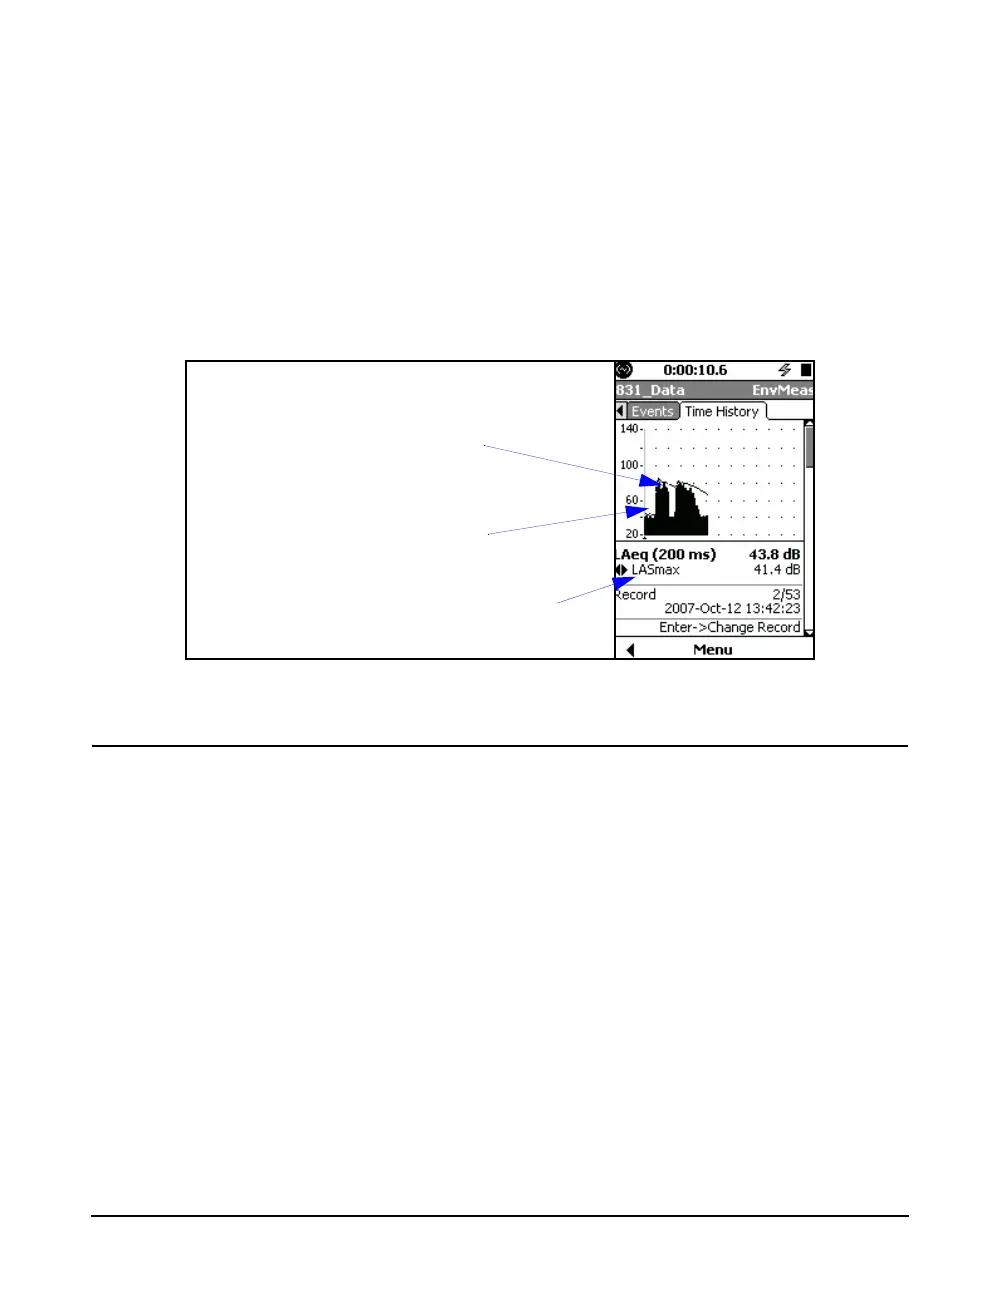
By pressing the 6 and 4 keys, the value displayed can be
shifted to represent a metric one later or earlier, respectively,
in sequence in the user-created list of metrics to log.
For example, in FIGURE 11-9 we have pressed the 6 key to
select LASmax, the next metric in the selection sequence, at
the same cursor position used to graph and display Leq in
FIGURE 11-7.
FIGURE 11-9 Time History Graph and Value of LASmax at Same Time
Frequency Spectra
When the Model 831 is equipped
with the optional firmware 831-OB3
and either the 1/1 octave spectra or
the 1/3 octave spectra, or both, have
been selected for the measurement,
then frequency spectra will appear
in the list of metrics which can be
logged.
When frequency spectra have been included in the list of
metrics to be measured in the setup, as described in "1/1 and
1/3 Octave Spectra” on page 11-3, there will be additional
displays as follows:
• One additional display if all frequency spectra
metrics are either 1/1 or 1/3 octave spectra. Press the
2 key to show the spectrum display as shown in
FIGURE 11-10.
• Two additional displays if frequency spectra metrics
include both 1/1 and 1/3 octave spectra. Press the 2
key once to display metrics having the 1/1 octave
format and press it a second time to display metrics
having the 1/3 octave format
Time History Graph:
Leq(x) where x is the time
history interval
Selected Parameter
Display, LApeak
Selected Metric