12-10 Display of Measurement History Data Model 831 Manual
Record Profile Display
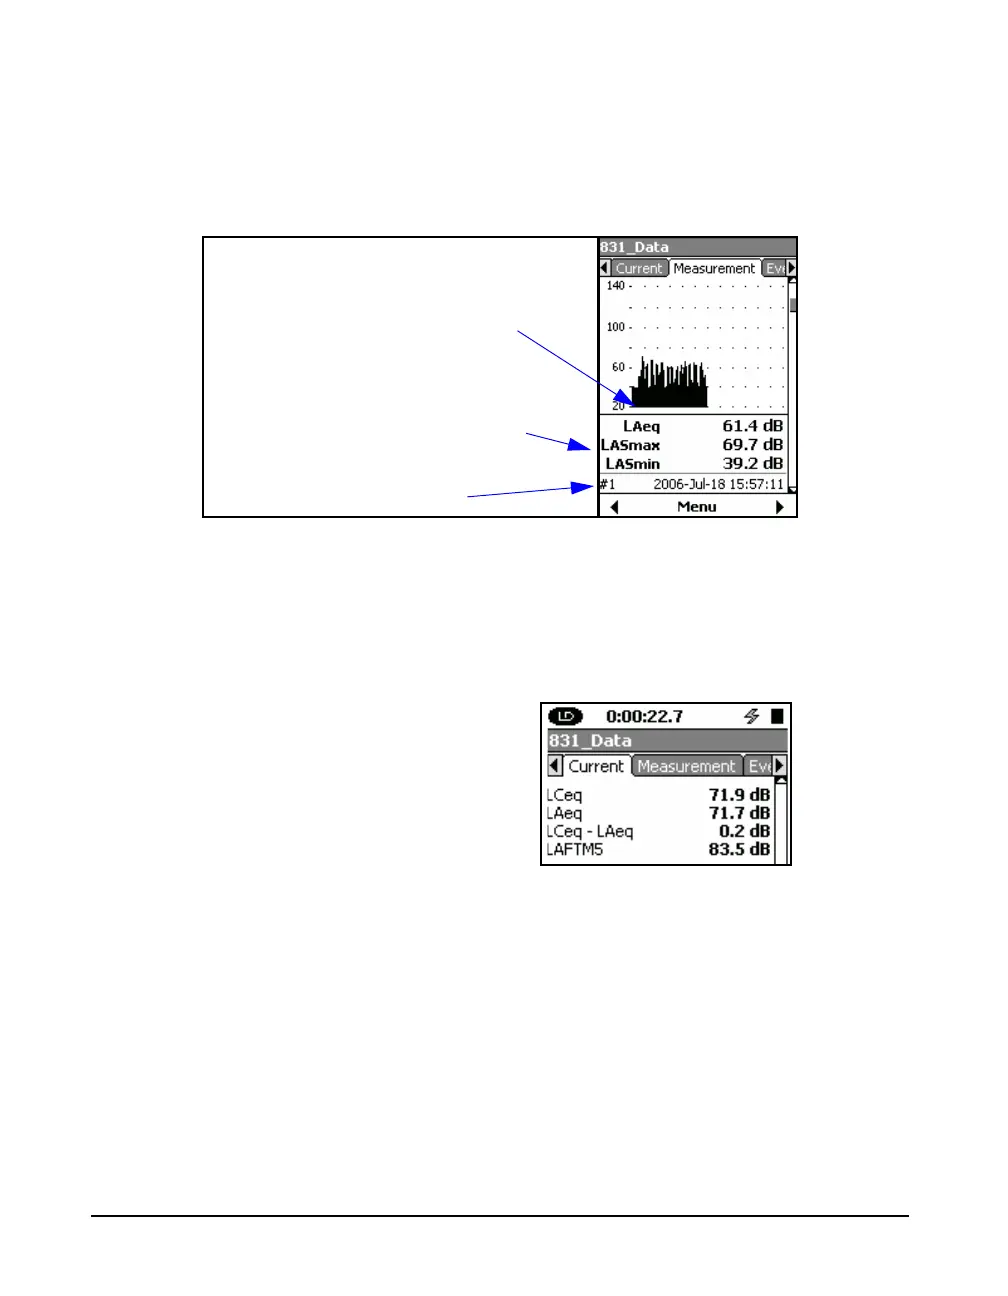
There is no cursor on this graph nor
a numerical display of amplitude or
time.
The third section on the Measurement tab presents a Profile
(Level versus Time) for the selected measurement record, as
shown in FIGURE 12-8
FIGURE 12-8 Profile Display: Measurement Tab
Equivalent Level Display
The Equivalent Level Display, shown in Figure 12-9, is a
condensed version of the Community Noise display shown
in Figure 5-23; the Lden and Ldn data do not appear in this
display.
FIGURE 12-9 Equivalent Levels: Measurement Tab
Changing Displayed Record
For the Measurement Record Display, shown in Figure 12-6
on page 12-7, the selected record number for which data is
being displayed in indicated at the upper right. For all other
displays, the selected record number is indicated below the
graph as shown in Figure 12-8 on page 12-10.
Level versus Time Graph
for the Selected Record
Leq and Maximum and
Minimum Levels for the Selected
Measurement Record
Selected Record Number