Network Setup 4-109
10.Click Cancel to close the dialog without committing updates to the running configuration.
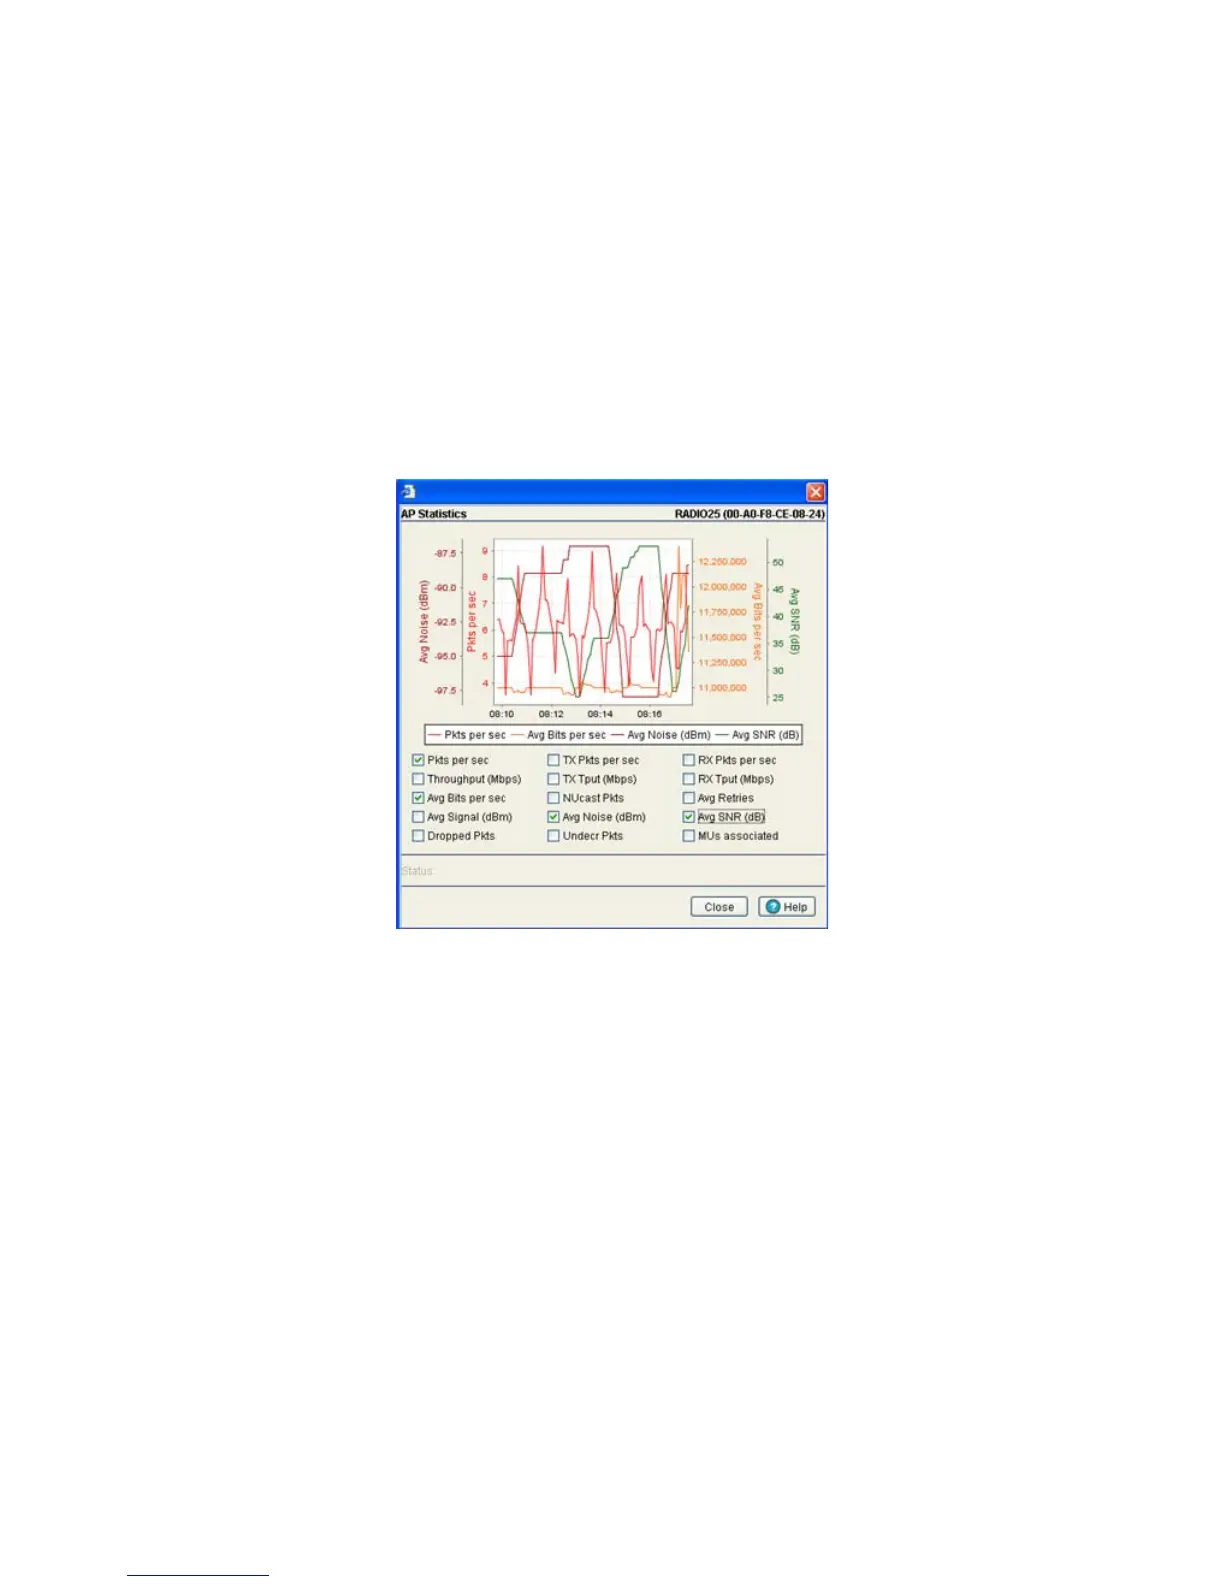
4.7.2.2 Viewing AP Statistics in Graphical Format
The Access Port Radios Statistics tab has an option for displaying detailed Access Port radio statistics
in a graph. This information can be used to chart associated switch radio performance and help diagnose
radio performance issues.
To view the MU Statistics in a graphical format:
1. Select a Network > Access Port Radios from the main menu tree.
2. Click the Statistics tab.
3. Select a radio index from the table displayed in the Statistics screen and click the Graph button.
4. Select a checkbox to display that metric charted within the graph. Do not select more than four
checkboxes at any one time.
5. Refer to the Status field for the current state of the requests made from applet. This field displays error
messages if something goes wrong in the transaction between the applet and the switch.
6. Click Close to exit the Graph and return to the parent Access Port Radios Statistics screen.
4.7.3 Configuring WLAN Assignment
The WLAN Assignment tab displays a high-level description of the radio. It also displays the radios WLAN
and BSSID assignments on a panel on the right-hand side of the screen.
To view existing WLAN Assignments:
1. Select Network > Access Port Radios from the main menu tree.
2. Click the WLAN Assignment tab.
 Loading...