132
ANALYZING TOMOGRAMS
4.2. Analyzing the Optic Disc
Select a patient on the main screen and then select a data to be analyzed. The automatic optic disc anal-
ysis is usable for the data of "3D Scan, 6.0×6.0mm, 512×128 pixels, and Fixation: Disc/External fixation".
(If the analysis is normally finished after photography, the result of the optic disc analysis is displayed
(without performing the following procedure) when opening the data.)
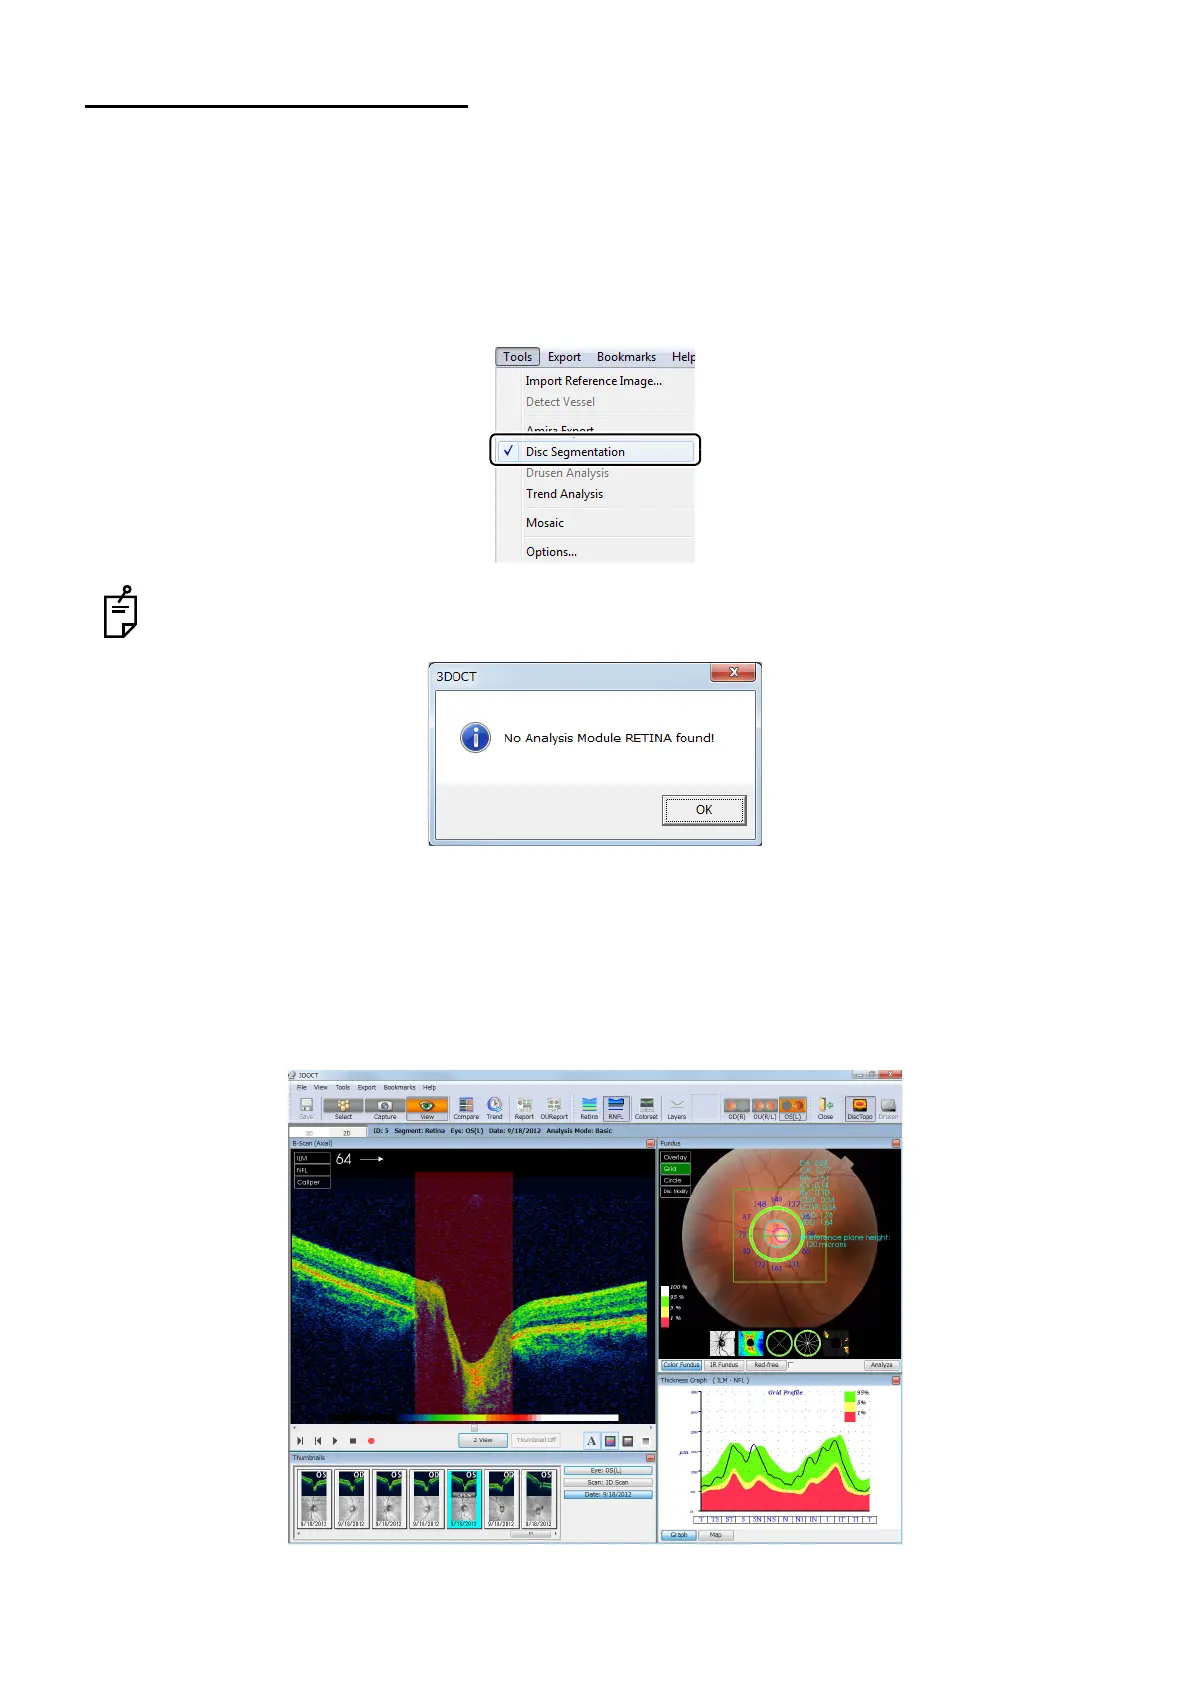
1 Select [Disc Segmentation] from the [Tools] menu, and the data is analyzed. When the data has
already been analyzed, the result of analysis is displayed.
When "Retina" and "RNFL Layers" are not analyzed yet for the displayed fundus tomogram data,
the following error is displayed.
When the error is displayed, press [Select] to return to the data list screen. Then, perform "ReAn-
alyze". Analysis is finished in several tens seconds. (It takes longer time depending on the per-
sonal computer.)
After the analysis is finished, open the data again.
2 The shape parameters and boundary are displayed on the color fundus image. On the tomo-
gram, the disc area is displayed in red.