31
CAPTURING TOMOGRAMS
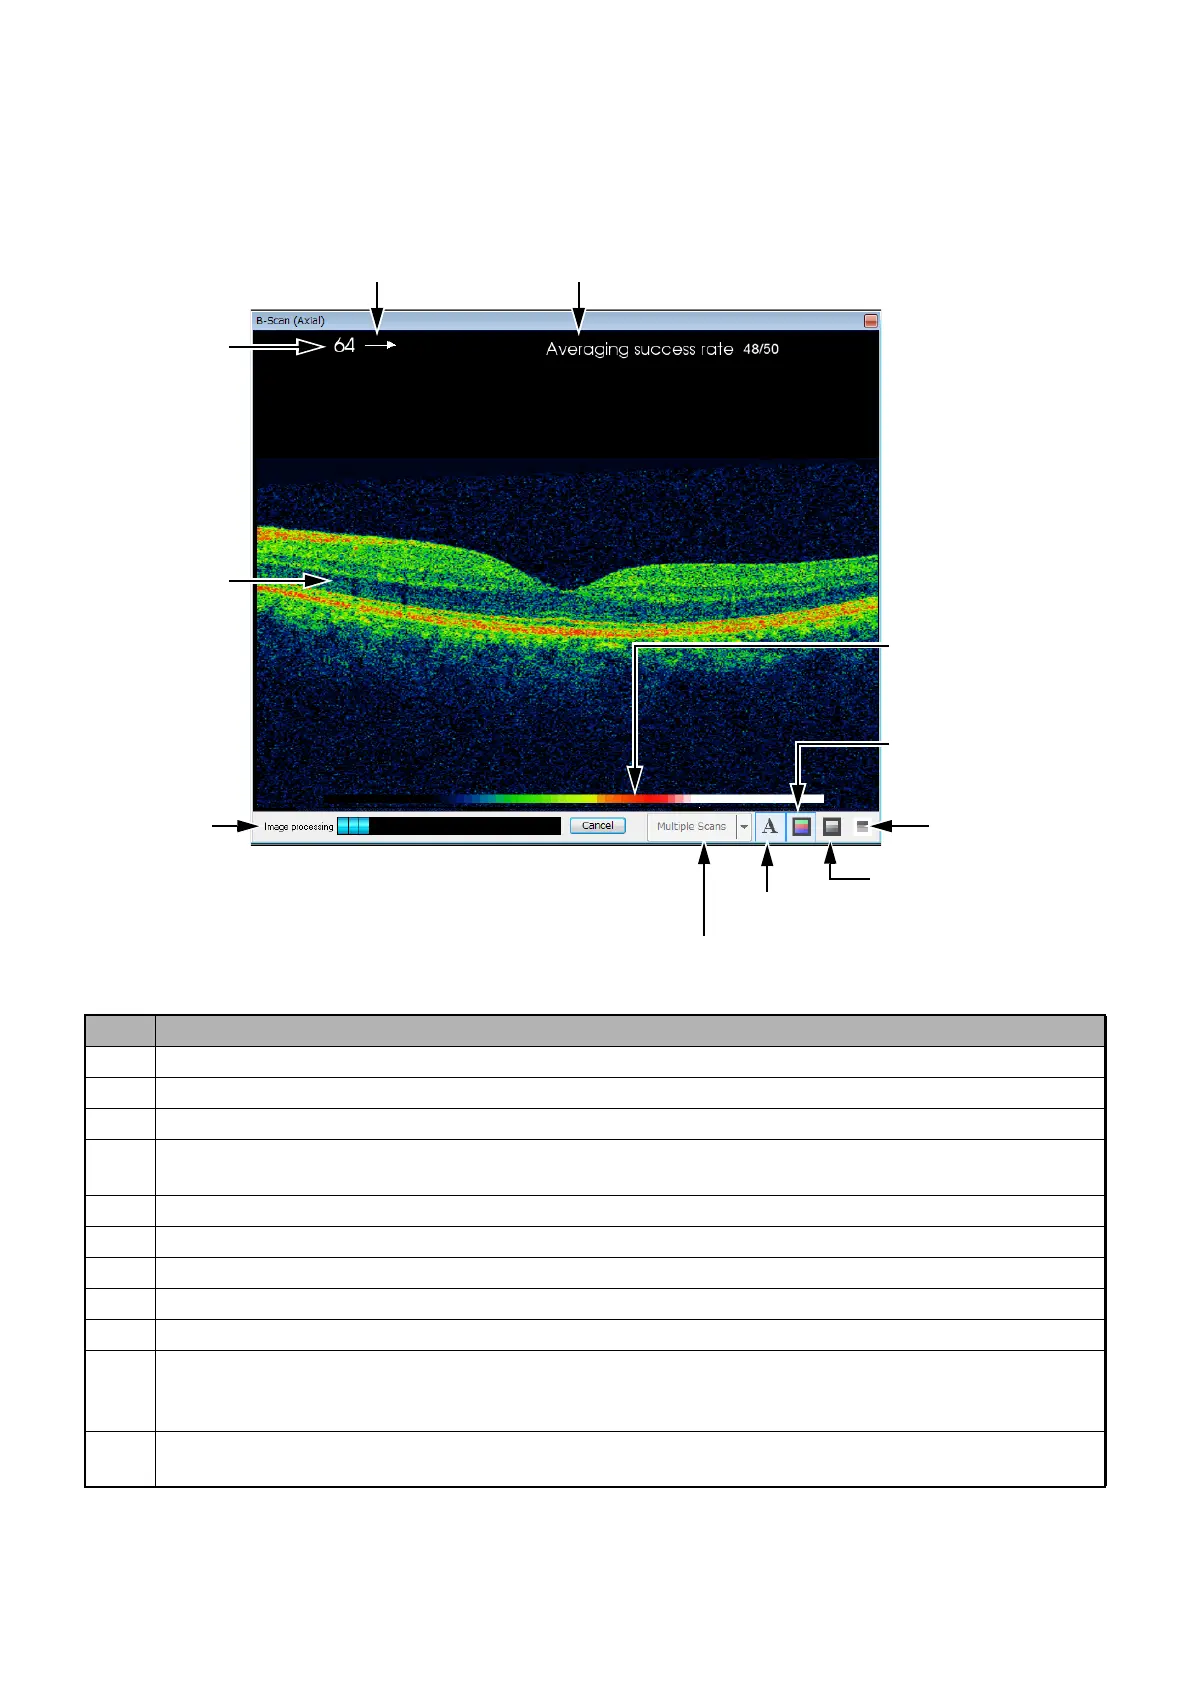
2.3.2. Primary Tomogram Viewing Area: Window A
• 2D mode
A 2D tomogram is displayed in this area. Before photographing, nothing is displayed because there is
no data. (Background: black)
ID Function
A-1 2D-scan tomogram
A-2 When one data has the scan images at two or more positions, this number indicates the positions.
A-3 Indicates the pseudo color or B/W colormap.
A-4 Indicates the scan direction. The displayed position means the direction where a picture has
been taken.
A-5 Shows/Hides annotations (A2 to A4). Indicates the color map of pseudo color or B/W.
A-6 Indicates the color map of pseudo color.
A-7 Toggle between color and B/W for the color map.
A-8 Reverses white and black as referring to the color of A-7.
A-9 Changes the quantity of the displayed tomograms on Window A.
A-10 This bar is displayed while imaging or overlapping is being executed after photographing. This
shows the progress of the processing. You can stop the processing with the [Cancel] button
next to this bar.
A-11 Displays "Overlap success image count/Set overlap image count".
(This is displayed only when overlapping is done.)
A-2:
Scan Position
Number
A-4:
Scan direction
A-1:
Tomogram
A-6:
Pseudo color display
A-8:
Reverse of B/W
A-5:
Annotation
A-9:
Changes the displayed image quantity.
Window A
A-11:
Overlap success image count
A-7:
B/W
A-10:
Progress bar
A-3:
Colormap