97
DISPLAYING TOMOGRAMS
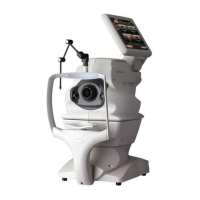
3.4.4. A-4: Thickness Graph Area
Explanation of Window
In 2D mode, the Thickness graph for the displayed tomogram is indicated.
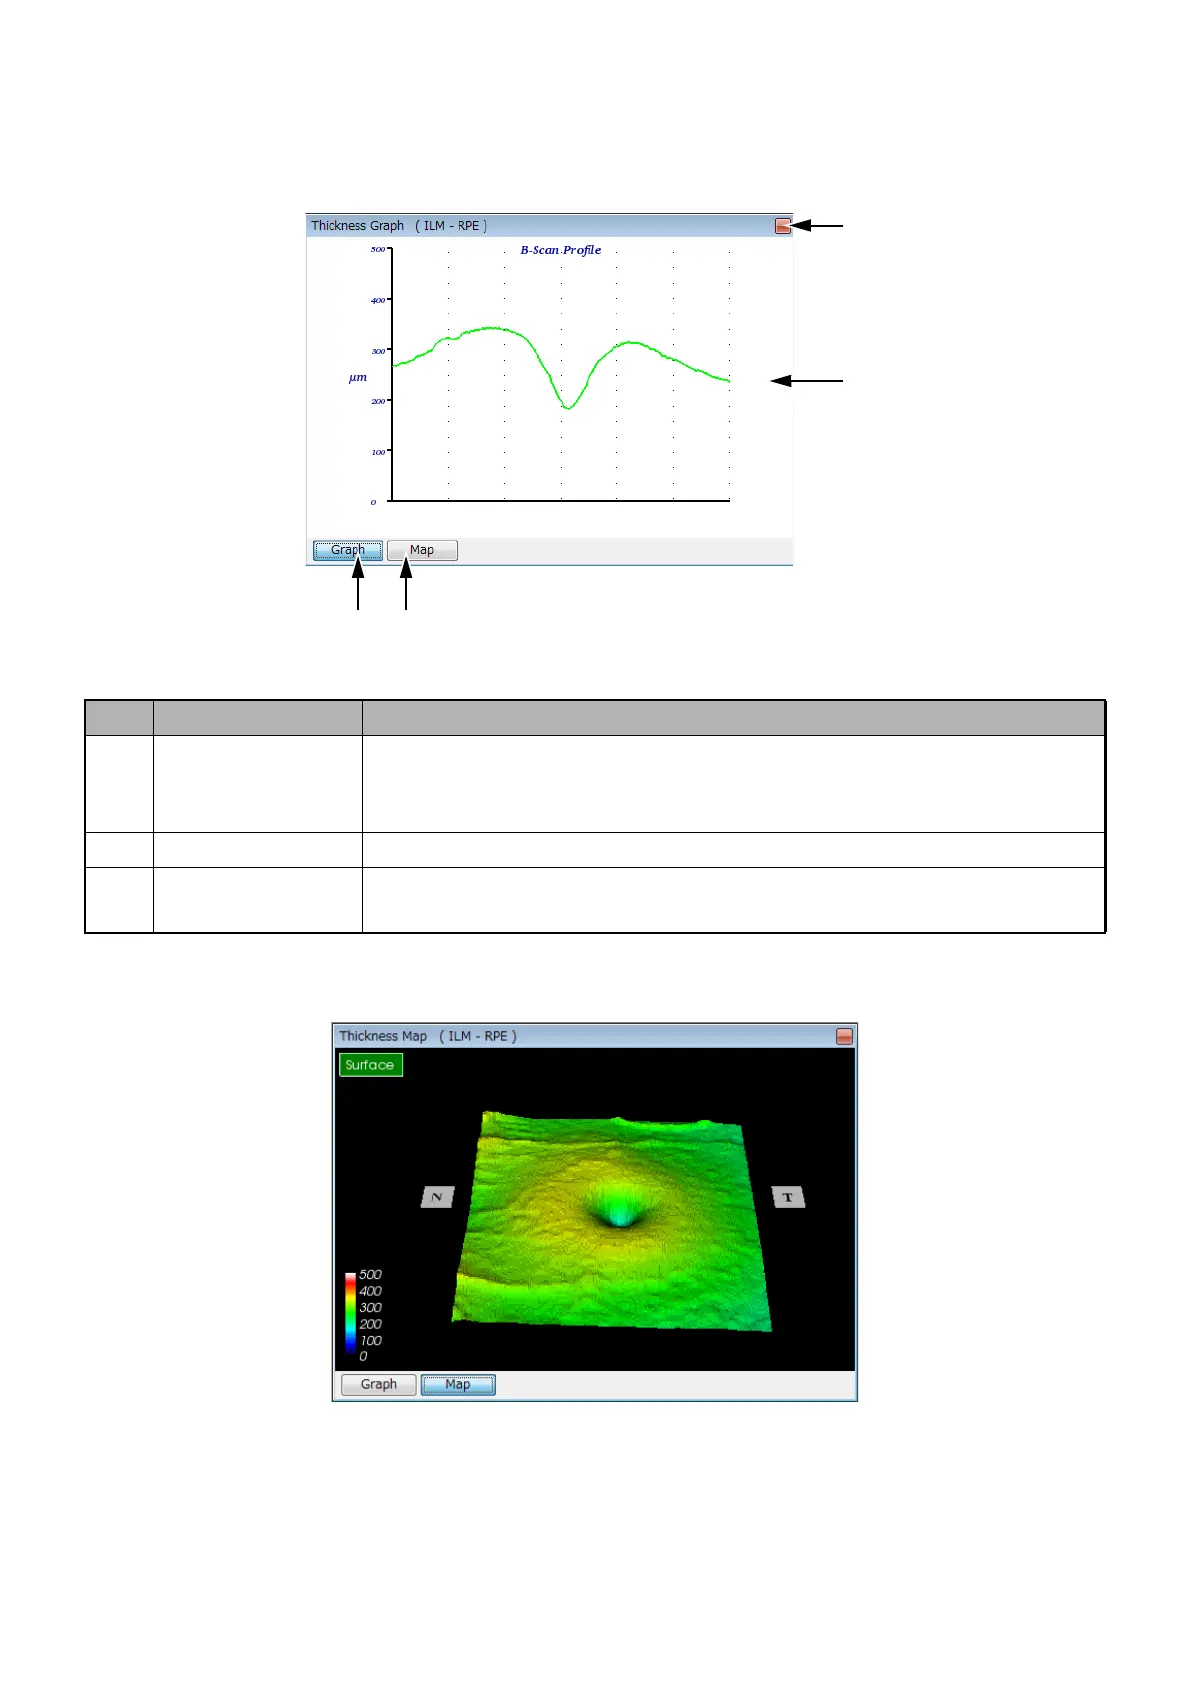
In 3D scan and Radial scan, it is possible to display the Thickness map.
How to use the menu
The menu is displayed only for Map. In the "Surface" menu, there are "Colormap", "Fundus Image" and
"Smooth". By using these items, it is possible to specify "Colormap display", "fundus image display" and
"Smoothing of image".
ID Name Description
D-1 Thickness Graph The graph about the depth between the layers corresponding to the tomo-
gram, which is displayed in the Primary Viewing Area (Window A), is indi-
cated.
D-2 Maximize Maximize this sub-window to the whole screen or return to its original size.
D-3 Change Graph and
Map to each other
Change the displays of Thickness graph and Thickness map to each
other.
D-3:
Change Graph and Map to each other.
D-1:
Thickness Graph
D-2:
Maximize