160
ANALYZING TOMOGRAMS
4.7.2. Outputting/saving the report
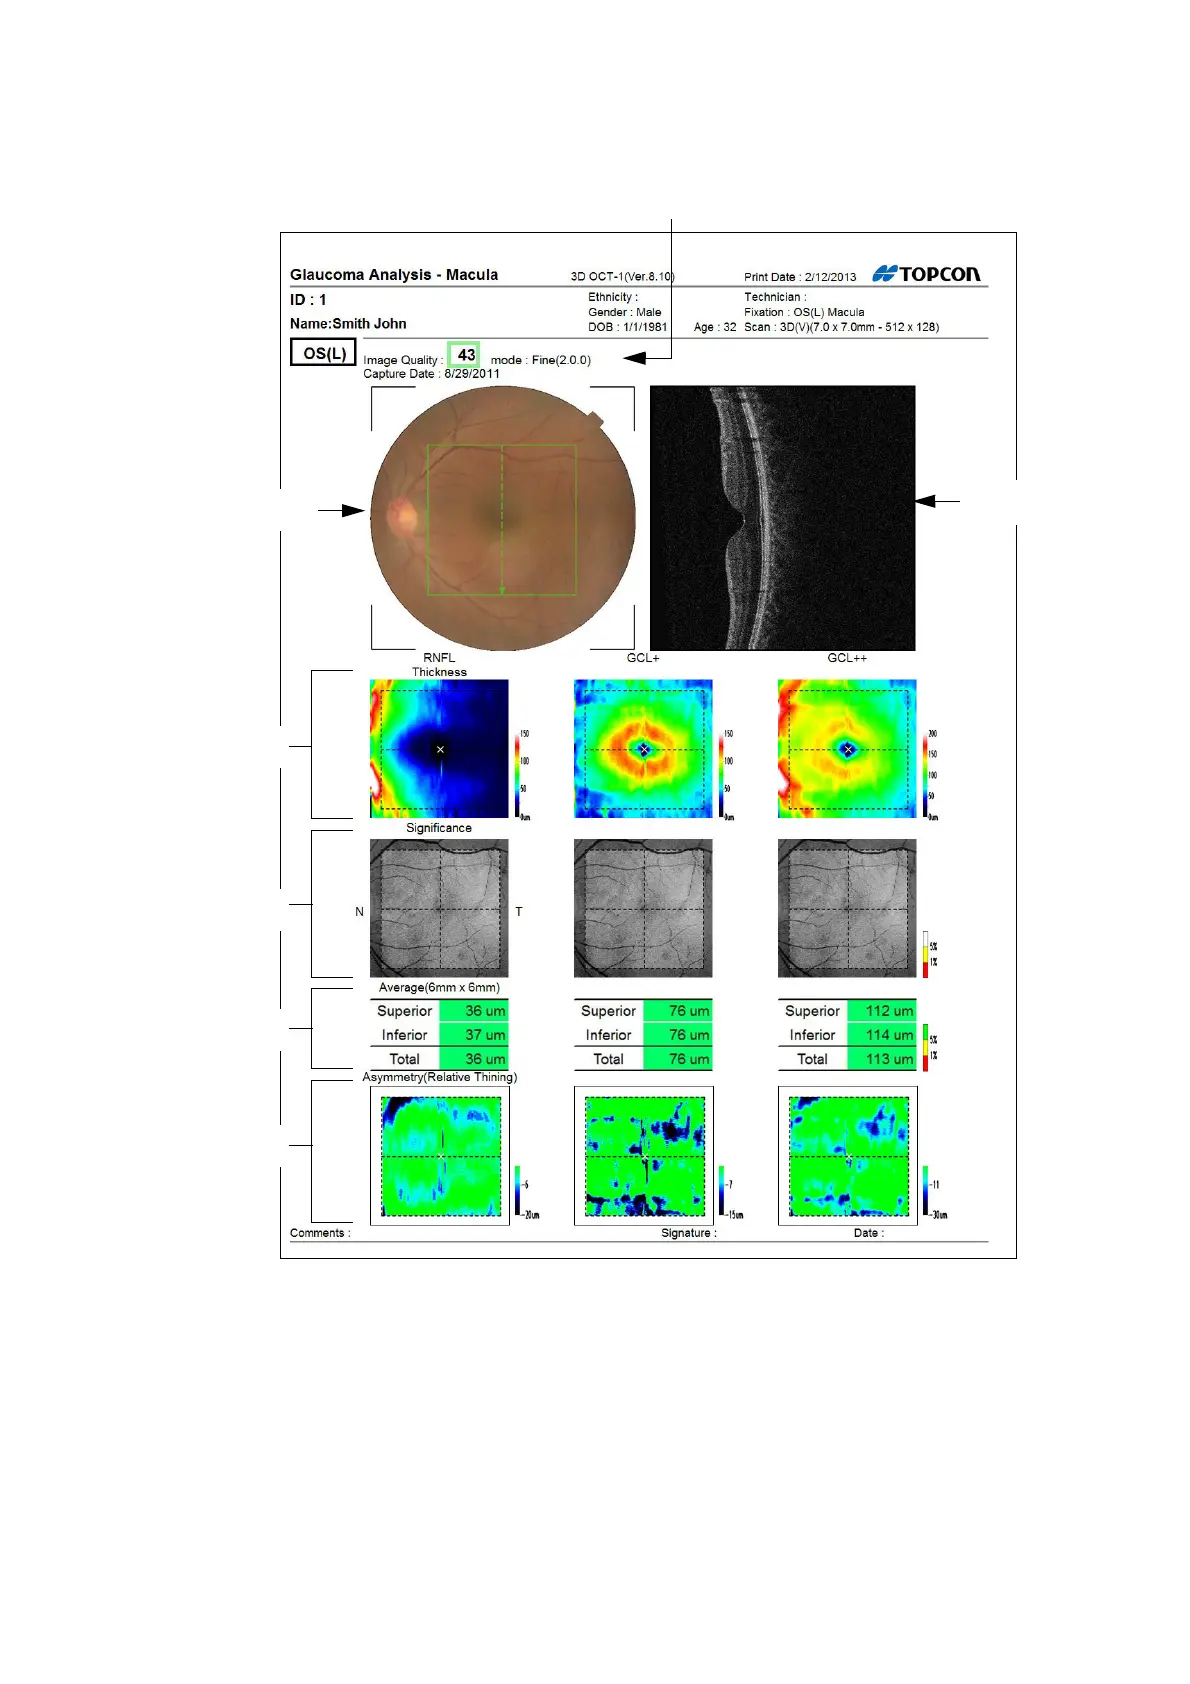
Refer to "Making Reports" on P.183. The following is an example of "Glaucoma Analysis in Macula"
report. Note that only one-eye report is available.
• Image Quality
If Image Quality is under 30, the value is displayed in red. If it is 30 and over, it is displayed in green.
• Thickness Map
From left to right, thickness maps of 7mm x 7mm of RNFL, GCL+ and GCL++ are shown.
OS Report (Left eye report)
Image Quality
Color fundus image
Thickness Map
Significance Map
Average Thickness
Asymmetry Map
Tomogram