990400 Rev C 2010 May 1
Detail Screens
9-17
The Ceph screen displays the Lateral Cephs in Radiographic and
MIP mode as well as a Coronal View in MIP mode, all at the
thickness of the volume. The last image is a Mid Sagittal Slice at
20mm thick.
Right-clicking the blank view at the bottom right of the Ceph screen
displays a single item popup menu. Clicking Tag Airways generates
a 3D view of the airways for the patient in the blank view. In
addition, the tagged airway data is graphed in the view at the bottom
center of the Ceph screen.
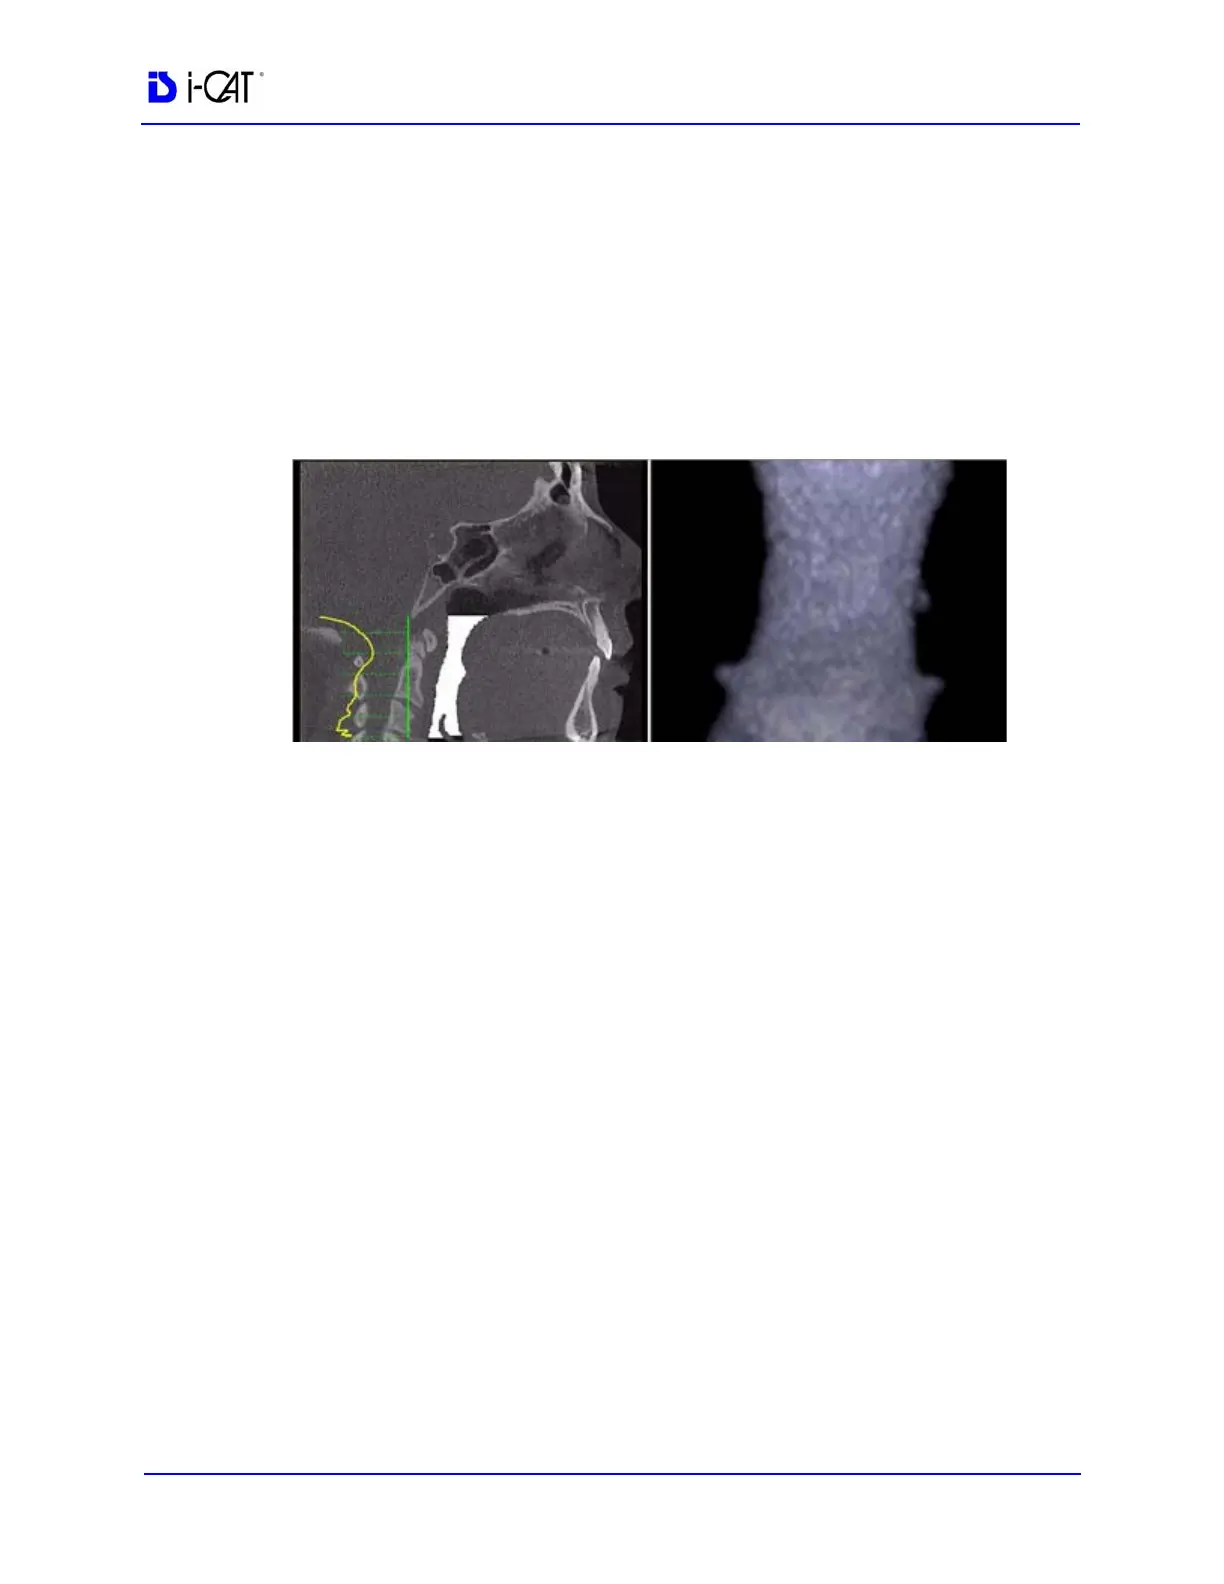
In the example below, the plot shows the opening of the airway
along the vertical axis of the graph. The green vertical line is the zero
line in the graph. The yellow curve shows the 3D width of the airway
along the Z direction of the volume and is proportional to the 3D
airway voxel volume in each corresponding axial slice. The red line
passes through an area in the airway which is narrower relative to the
surrounding area. This is depicted by a dip in the yellow curve
toward the green vertical zero line of the graph.
Since a constriction could be present in the depth of the image, a
single image may not be sufficient to assess airway volume.
However, the curve is accurate since it is created from the airway
volume contained in each slice along the Z direction. The amplitude
at every point in the yellow curve is a true 3D representation of the
airway volume at the corresponding axial slice location.