17-19 Operators’ Manual
990400 Rev C 2010 May 1
12-12
Noise Level Test
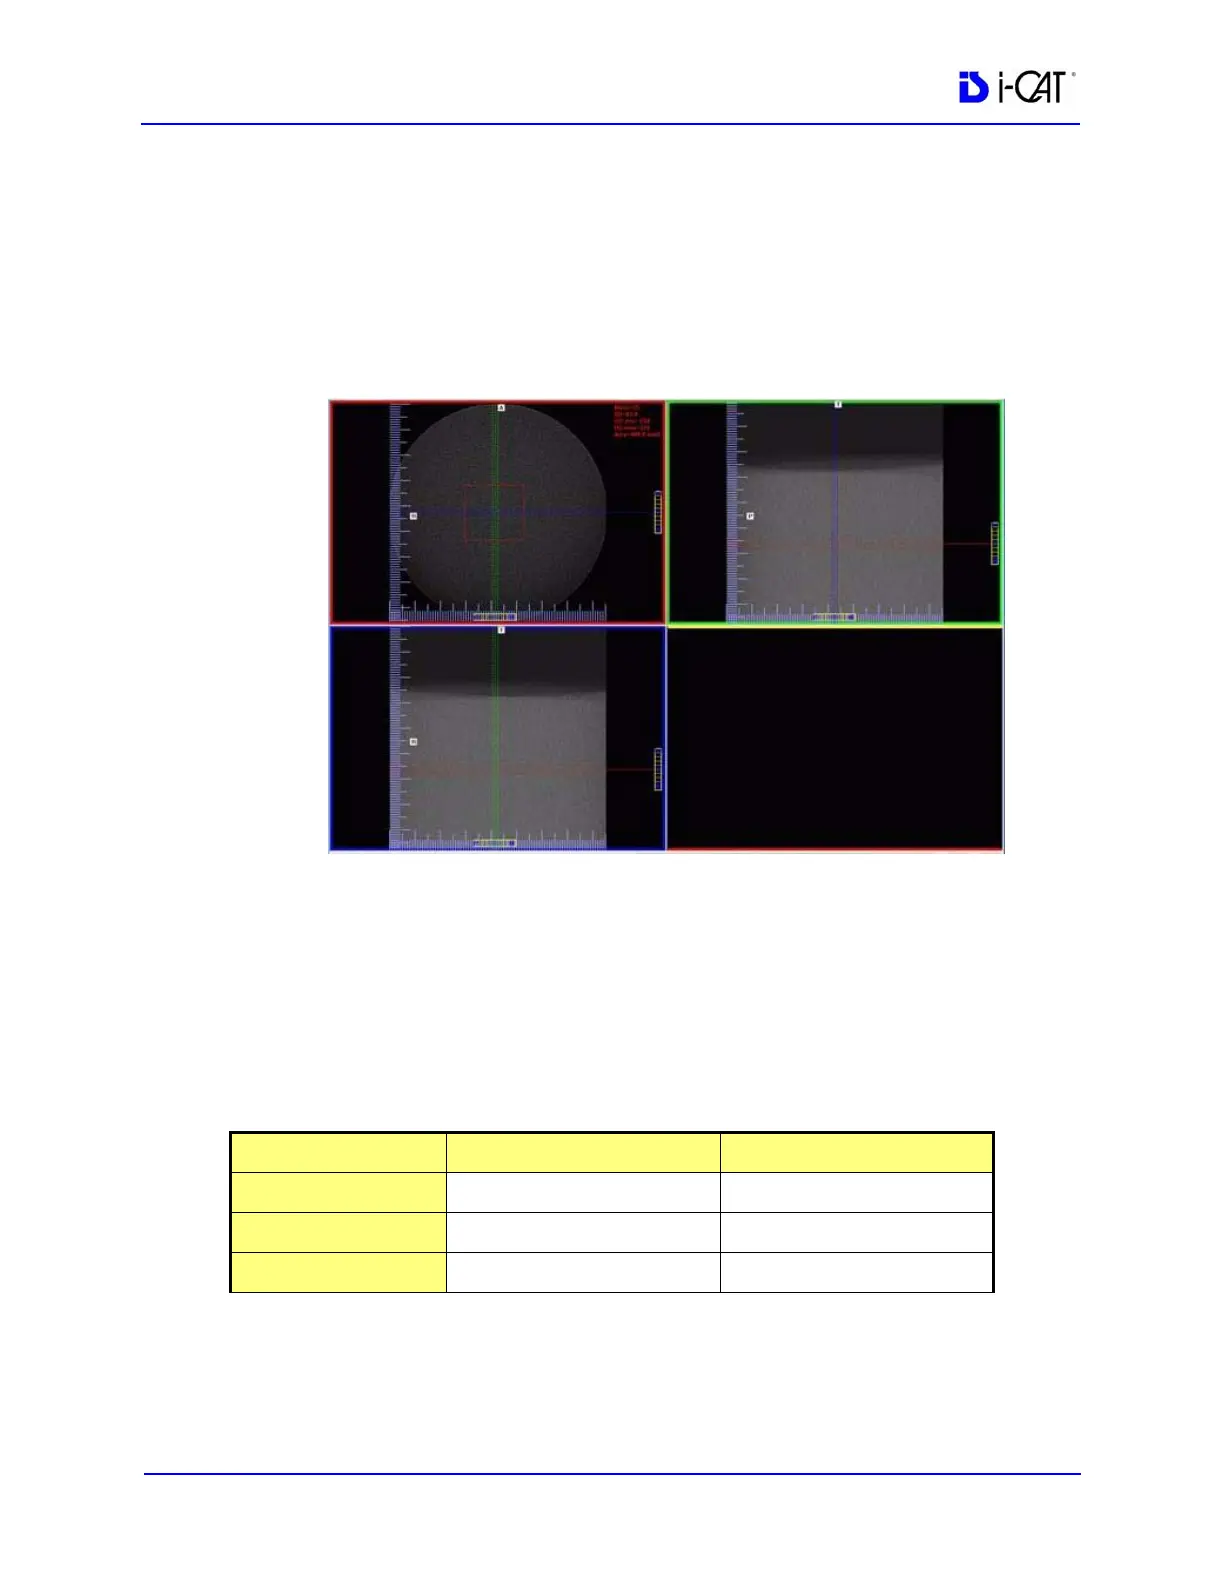
17. Zoom the Axial image (upper left). To zoom, start at the lower
right corner of the image and drag the cursor across the image.
18. At the bottom of the top-right image scale, click and hold the
cursor on the ● symbol. The slice thickness is displayed. Slide
the cursor up to change the value to 0.4 mm
19. Right click the image and select HU Statistics from the menu
(also, right click to turn off HU Statistics).
Use the Region Tool to define a ROI (Region of Interest) in the
center of Water, as shown above.
HU Area (box size) should be approximately 400.0 mm
2
20. Note and record the Mean and Standard Deviation values of both
the Water and Air areas. See chart below.
NOTE: Do not close image. This image is also used for the
Uniformity Test (next procedure).
Measured Values Water Air
Mean
Expected Values 0 (-70 to +70) -1000 (-50 to +50)
SD