Model 831 Manual View Spectrum Normalized 5-37
Overall Display
In general, obtaining a normalized display of 1/1 and 1/3
octave spectra appearing on the Overall tab is the same as
for Live Displays, described in "Live Display" on page 5-30.
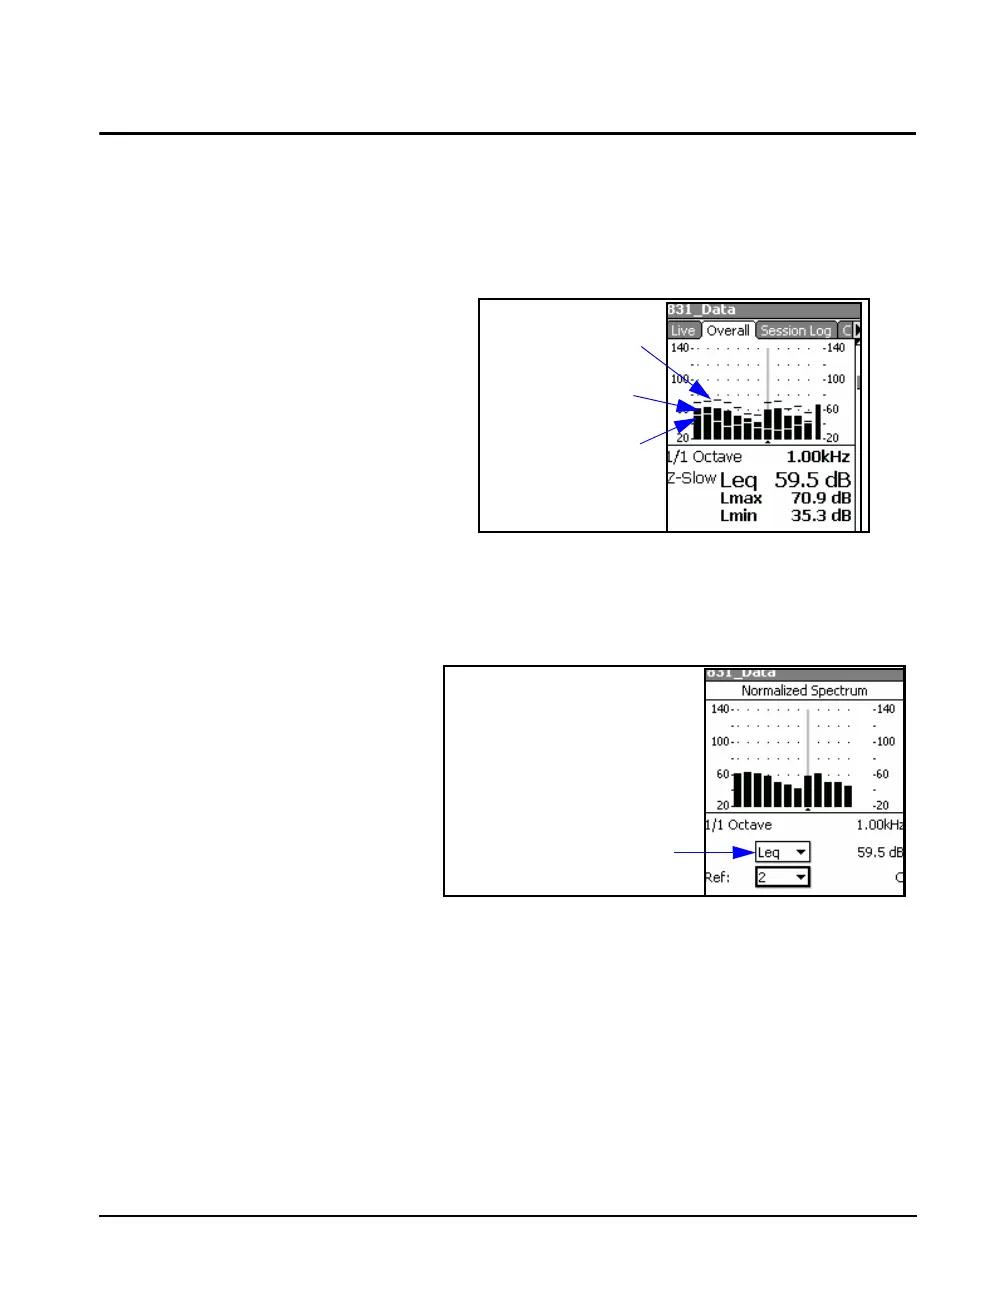
The major difference is that spectra appearing on the
Overall tab display Leq, Lmax and Lmin data
simultaneously, as shown in FIGURE 5-43.
FIGURE 5-43 Overall Spectrum
As a result, when setting up for View Normalized, if no
normalization spectrum has been selected, the display will
look as shown in FIGURE 5-44.
FIGURE 5-44 Normalized Overall Spectrum: No
Reference Selected
The Leq in the data field shown highlighted above indicates
that the spectrum being displayed is Leq. With this data field
highlighted, press
5 to open the menu shown in FIGURE
5-45.
Lmin Spectrum
Leq Spectrum
Lmax Spectrum