5-18 Overall Tab Model 831 Manual
Note that the graph scaling can be
modified as described in section
"Adjust Graph Scale" on page 5-29
and the display normalized to
another spectrum, as described in
section "View Spectrum Normalized"
on page 5-30.
The data displayed on this page is similar to that displayed
for a 1/1 octave spectrum measurement, described in "1/1
Octave Band Analyzer (Optional)" on page 5-16, except that
it represents 1/3 octave data.
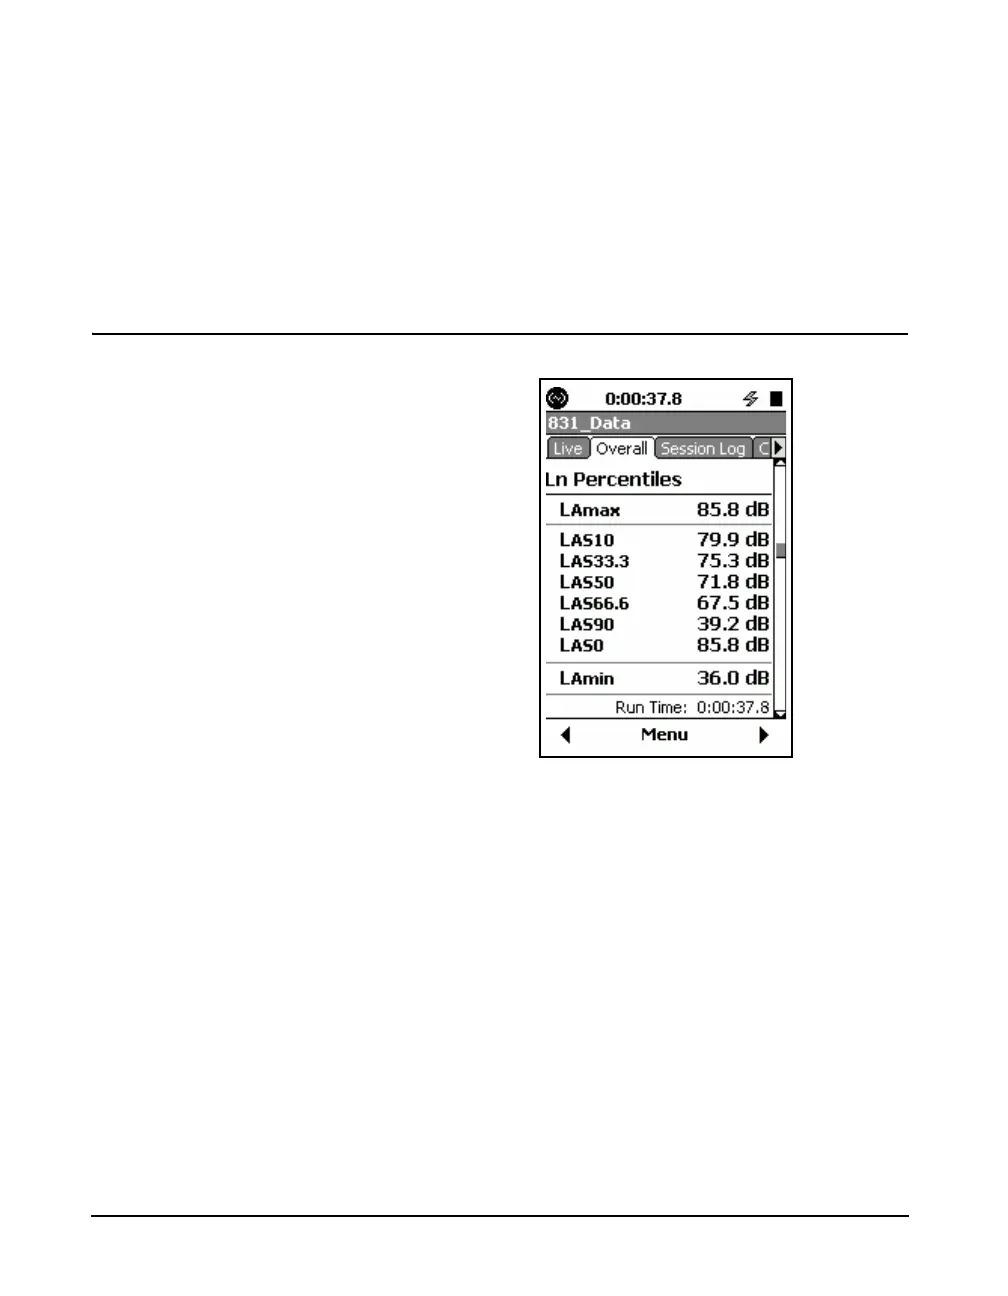
Ln Percentiles
FIGURE 5-18 Overall Tab: Ln Percentiles
The Ln Percentiles page displays the Ln statistics for the
measurement based on the run time. Also shown are the
maximum and minimum sound levels measured. An Ln is
the level that was exceeded “n” percent of the time.
The values of Ln are calculated from an amplitude
distribution table, ranging from 0 to 200 dB, in 0.1 dB steps.
As a result, it is possible to calculate Ln values from values
of n ranging from 00.01% to 99.99%. The values shown in
FIGURE 5-18 represent the six values which were selected
for display during setup. At any time during a measurement,
any or all of these Ln values can be changed, as described in
"Modifying Ln Values During a Measurement” on page 4-8,
so that Ln values corresponding to different values of n may
be displayed.