5-20 Overall Tab Model 831 Manual
Spectral Ln (Optional)
The Spectral Ln display appears
only when the optional 831-OB3
firmware has been enabled and the
Spectral Ln Mode set for 1/1 or 1/3
octave measurements, as described
in "Spectral Ln Mode" on page 4-7.
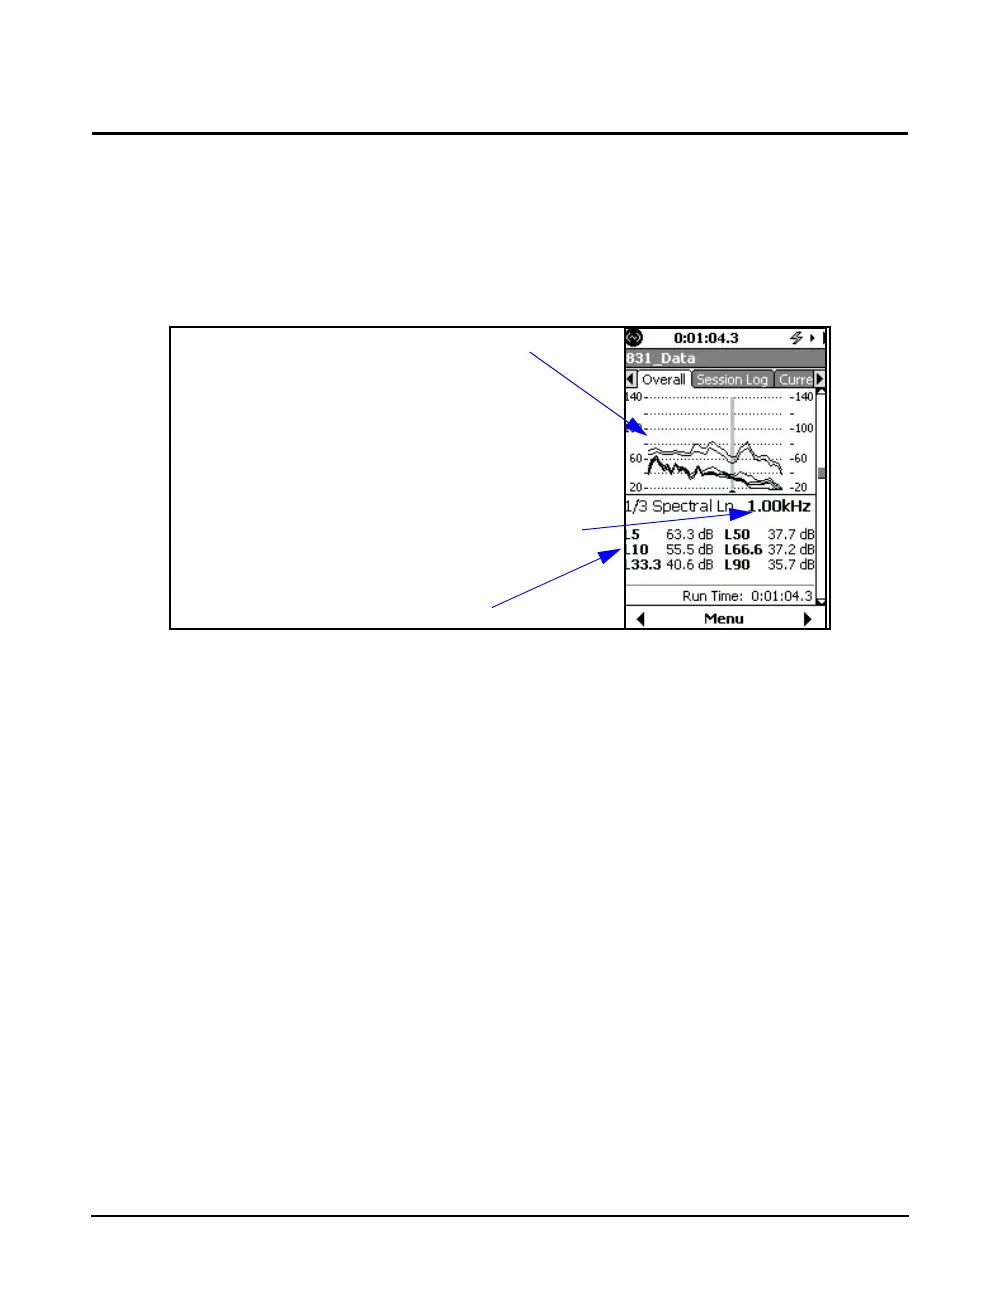
FIGURE 5-20 Overall Tab: Spectral Ln
The graph shown in FIGURE 5-20 overlays curves of Ln as
a function of frequency for the six values of n defined in the
setup, as described in "Ln Tab" on page 4-7. These are the
same n values used in the display of overall Ln in "Overall
Tab: Ln Percentiles" on page 5-18.
Note that the graph scaling can be
modified as described in section
"Adjust Graph Scale" on page 5-29.
Numerical values of Ln for the six user-selected values of n
at the frequency corresponding to the cursor position are
displayed as indicated in FIGURE 5-20. Use the 4 and 6
keys to move the cursor left and right, respectively, along the
frequency axis.
See "Spectral Statistics" on page 24-5 for a more detailed
description of spectral Ln measurements.
Ln as a function of frequency for
six user-selected values of n
Frequency at cursor position
Ln values at cursor position