146 PI-MAX
®
4 System Manual Issue 9
15. After verifying all connections and equipment readiness, click on Acquire to begin
acquiring spectra or images.
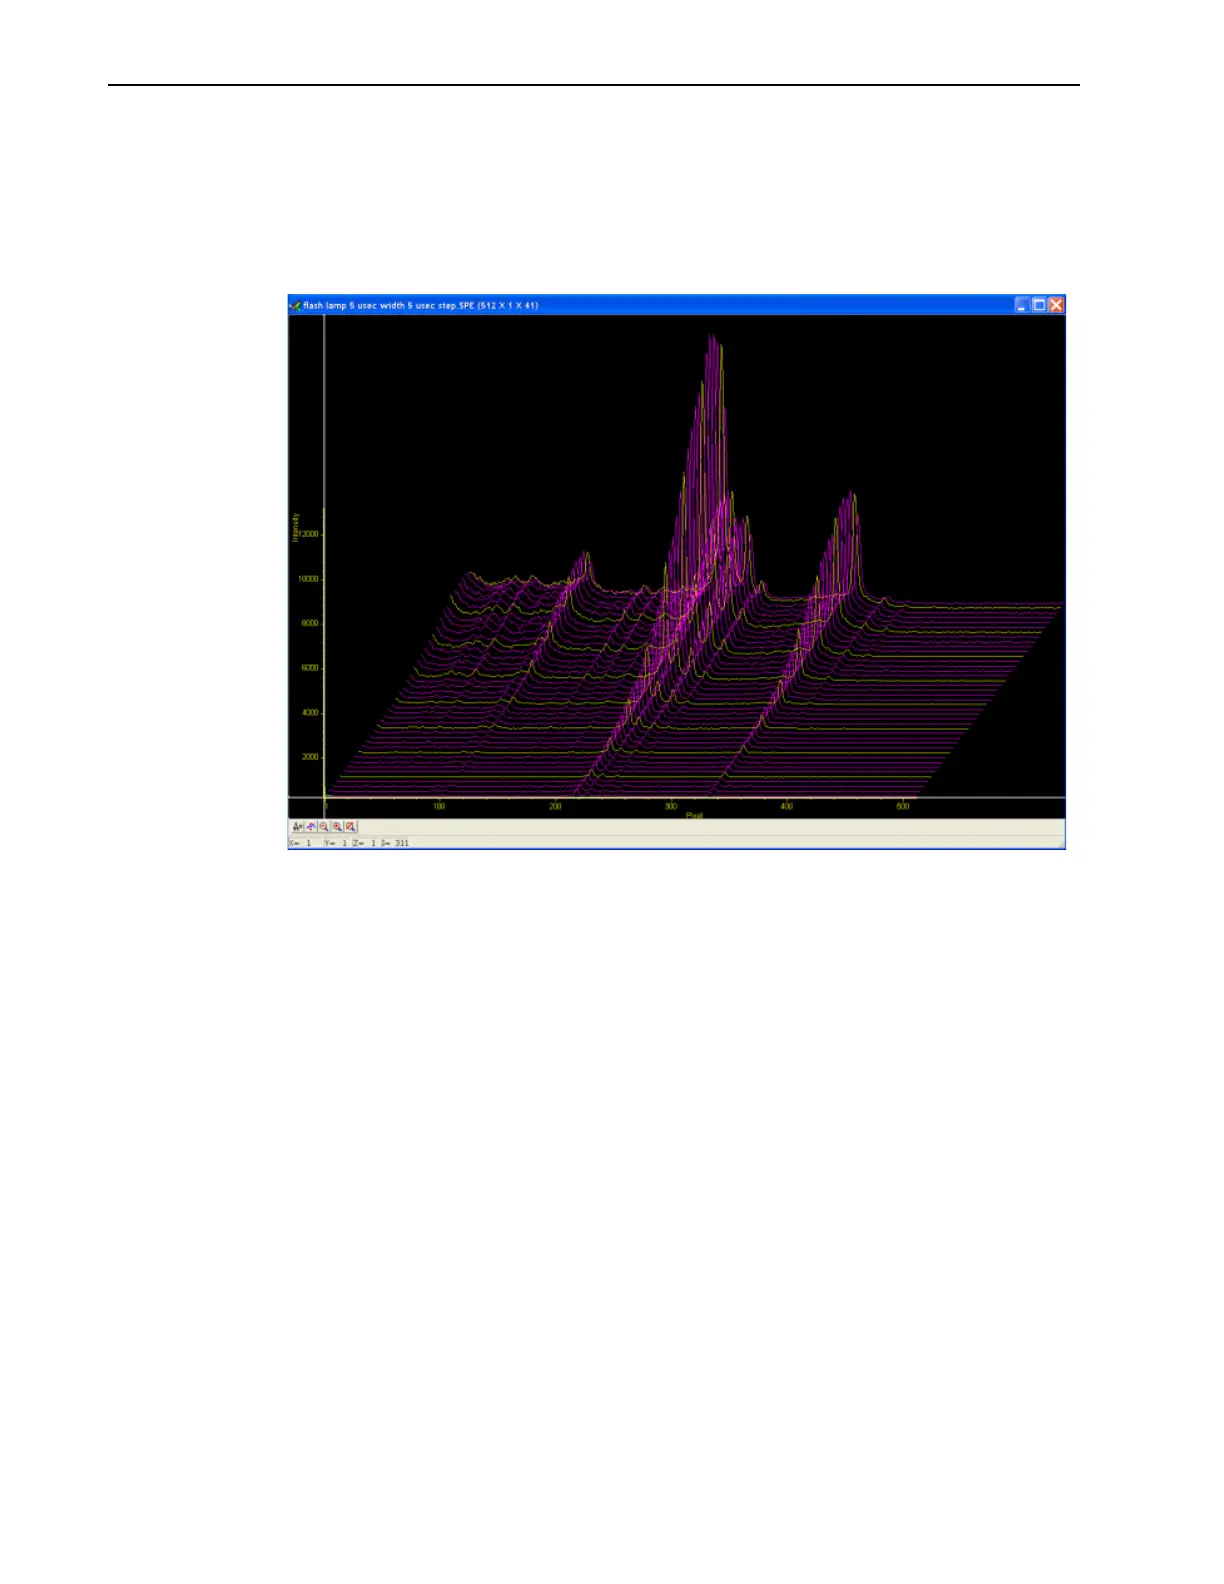
16. Figure 7-22 illustrates a 3-D graph obtained for a Sequential-Repetitive experiment
with Fixed Width and Variable Delay. See Figure 7-15 through Figure 7-18 for
configuration settings.
Figure 7-22: Typical Experiment Results Shown in 3-D