314 Installation Testing and Verification
Verification Test Graphical Reports
Verification tests produce graphical reports that let you easily see if the test generated passed, marginal, or
failed results. Each result is shown in a different color:
• P - passed (green)
• M - marginal (yellow)
• F - failed (red)
There are eight types of graphical reports. Each individual test generates two or more graphical reports
(except for the scan barcode test, which does not generate graphical reports). The following sections show
an example of each type of graphical report and actions to take to correct a marginal or failed result.
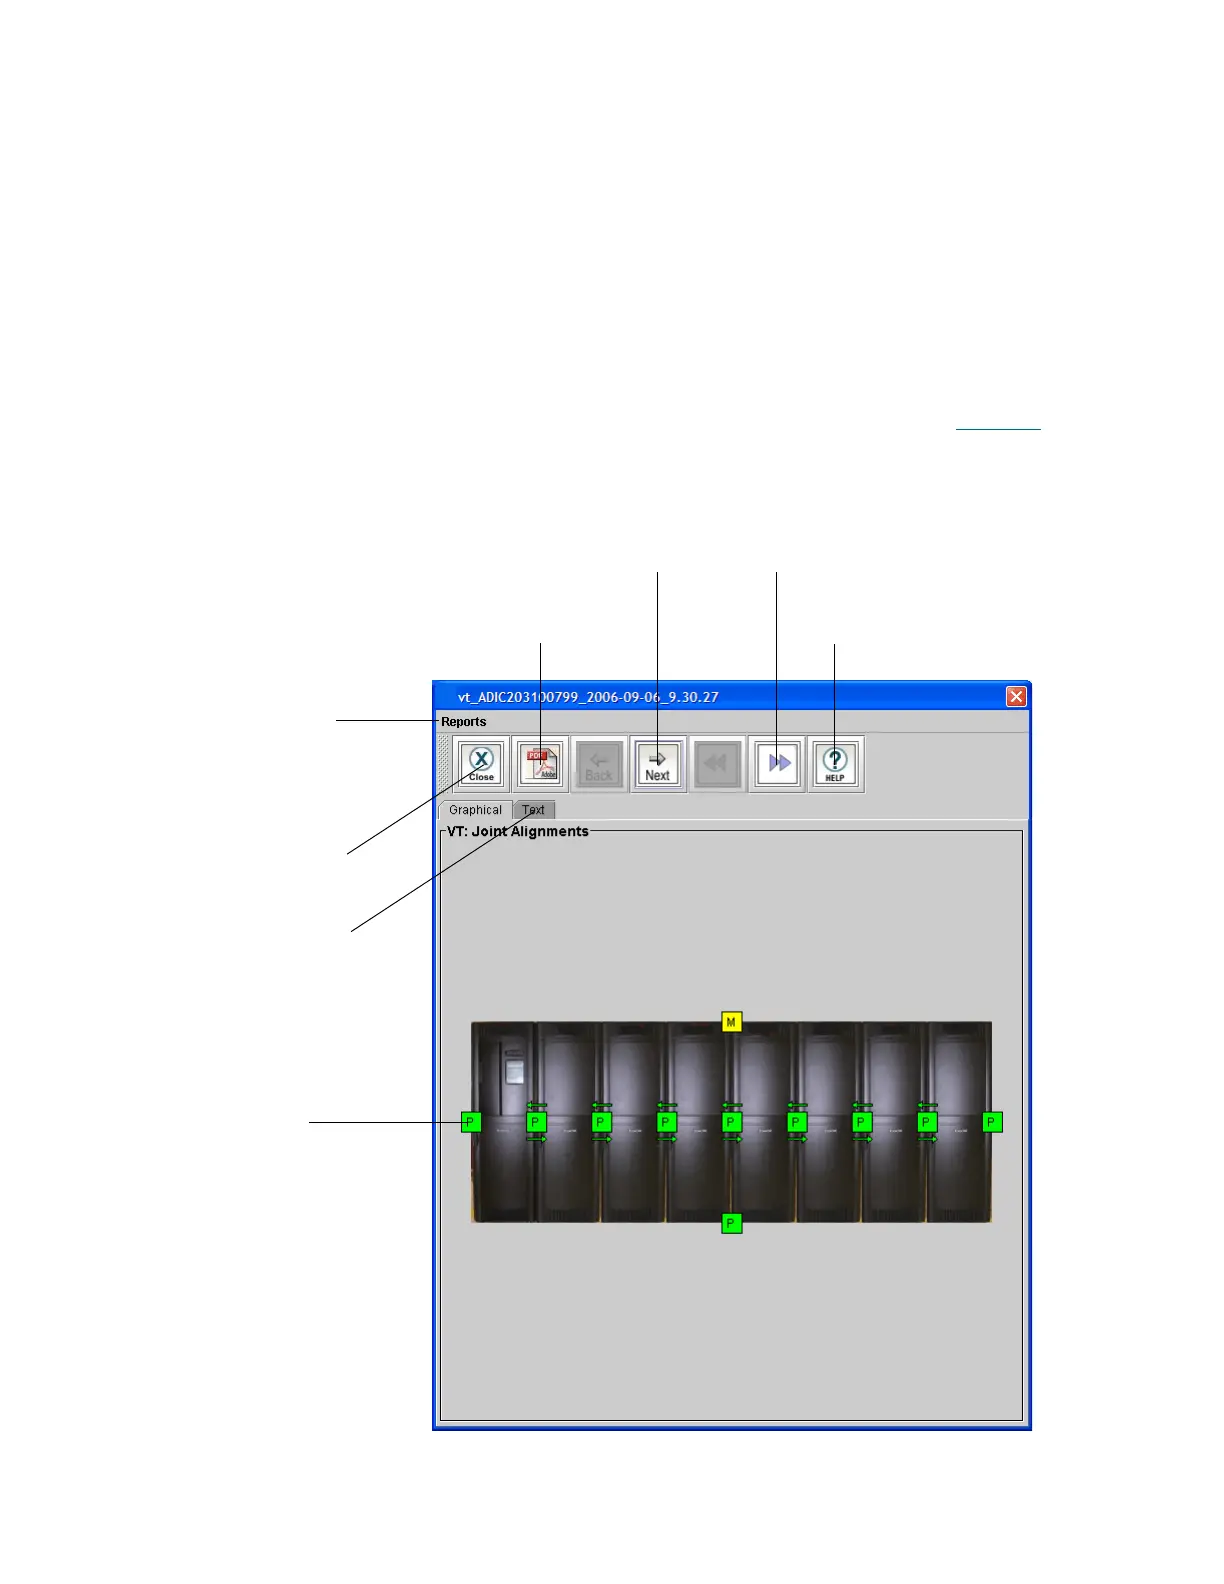
To view the graphical reports for a test, click Reports on the Verification Tests dialog box. Figure 26
shows the parts of the report window.
Figure 26 Report Window
graphic showing P
(passed), M (marginal),
and F (failed) results
click to view the text log
click to close the report
window
click to see results
for the next test
click to see results
for the next frame
click to save a copy of
the results in PDF format
click to display results
for a previously run test
(results for the last five
tests are retained)
click to view Online
Help
 Loading...