RADWIN2000+SeriesUserManual Release4.2.40 20‐6
RunningSpectrumView
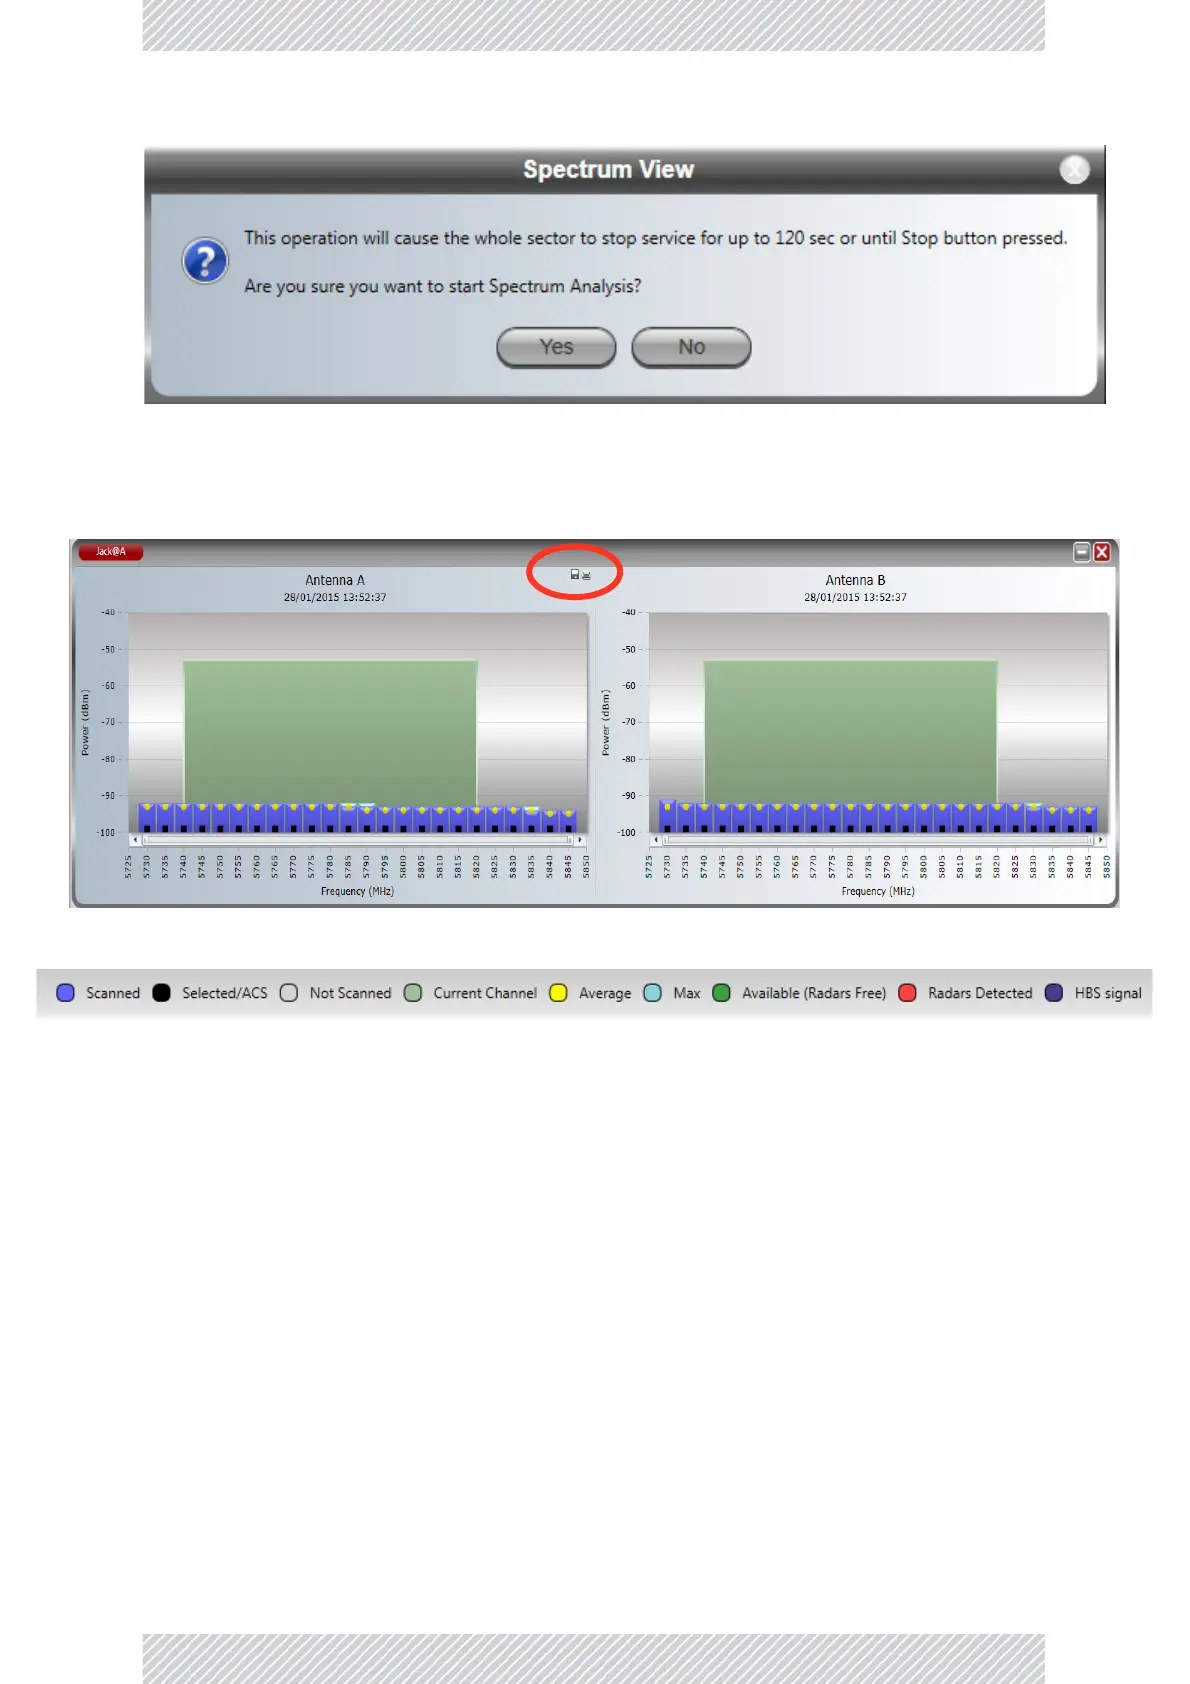
IfitisacceptabletodroptheserviceclickYes.Theprocessingmayappeartohavestopped‐
butitisnotcompleteuntilalloftheShowbutt onsforlinkareenabled.
HereistheresultfortheRT‐A(HBS):
Thek eystothecolorcodingispermanentlydisplayedatthebottomofthemainwindow:
Figure20‐1:SpectrumViewAnalysiscolorcodes
ThegreenbandreflectsthecurrentMasteroperatingfrequency.Noticealsothesmallfly‐
overdisketteicon(circled)totheupperleftofeithergraph.ClickingitopensaWindowsFile‐
Savedialogallowingyoutosavethegraphtodiskasajpgfile.
HereistheanalysisforRT‐B(HSU).Itisverysimilar: