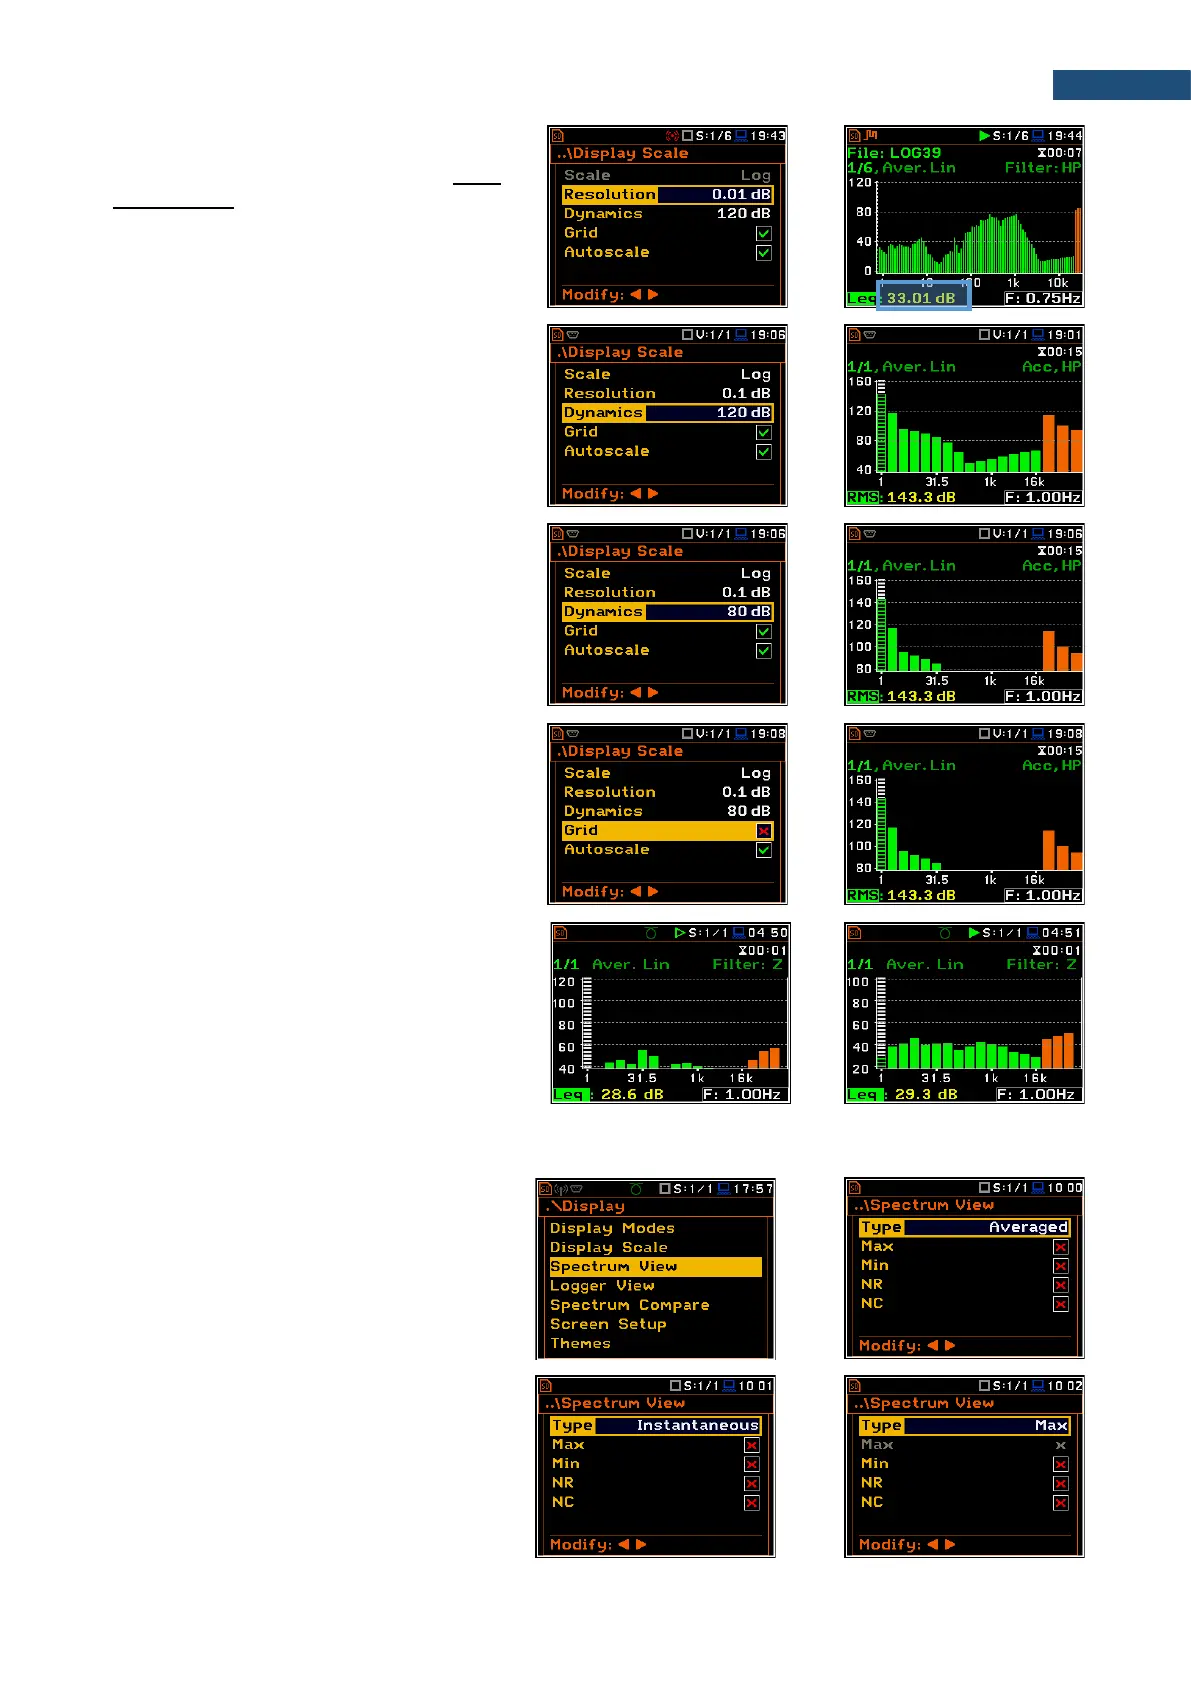
Resolution
The Resolution parameter appears when
Scale is Log and defines the number of
digits after the decimal point in the
presented results: one digit after the decimal
point (0.1 dB) or two digits after the decimal
point (0.01 dB).
Scaling the vertical axis
The Dynamics parameter defines the
dynamic range of the Y-axis scale.
It is possible to select the range from the set:
10dB, 20dB, 40dB, 80dB, 100dB and
120dB.
Toggling the grid
The Grid position allows you to toggle the
horizontal grid lines of the logger or
spectrum plot.
Switching the automatic Y-scale
adjustment on/off
The Autoscale position switches on the
automatic adjustment of the Y scale. Auto
scaling is performed only once at the start of
the measurement to set the most
appropriate scaling for the display.
10.3.3 Selecting spectra to be viewed – Spectrum View
In the Spectrum View screen, you can
select the different spectra to be viewed in
the Spectrum display mode: instantaneous,
averaged, maximum or minimum.
In the Type position, you may choose the
spectrum type to be presented as a bar plot
in the Spectrum view: Averaged,
Instantaneous, Max or Min.