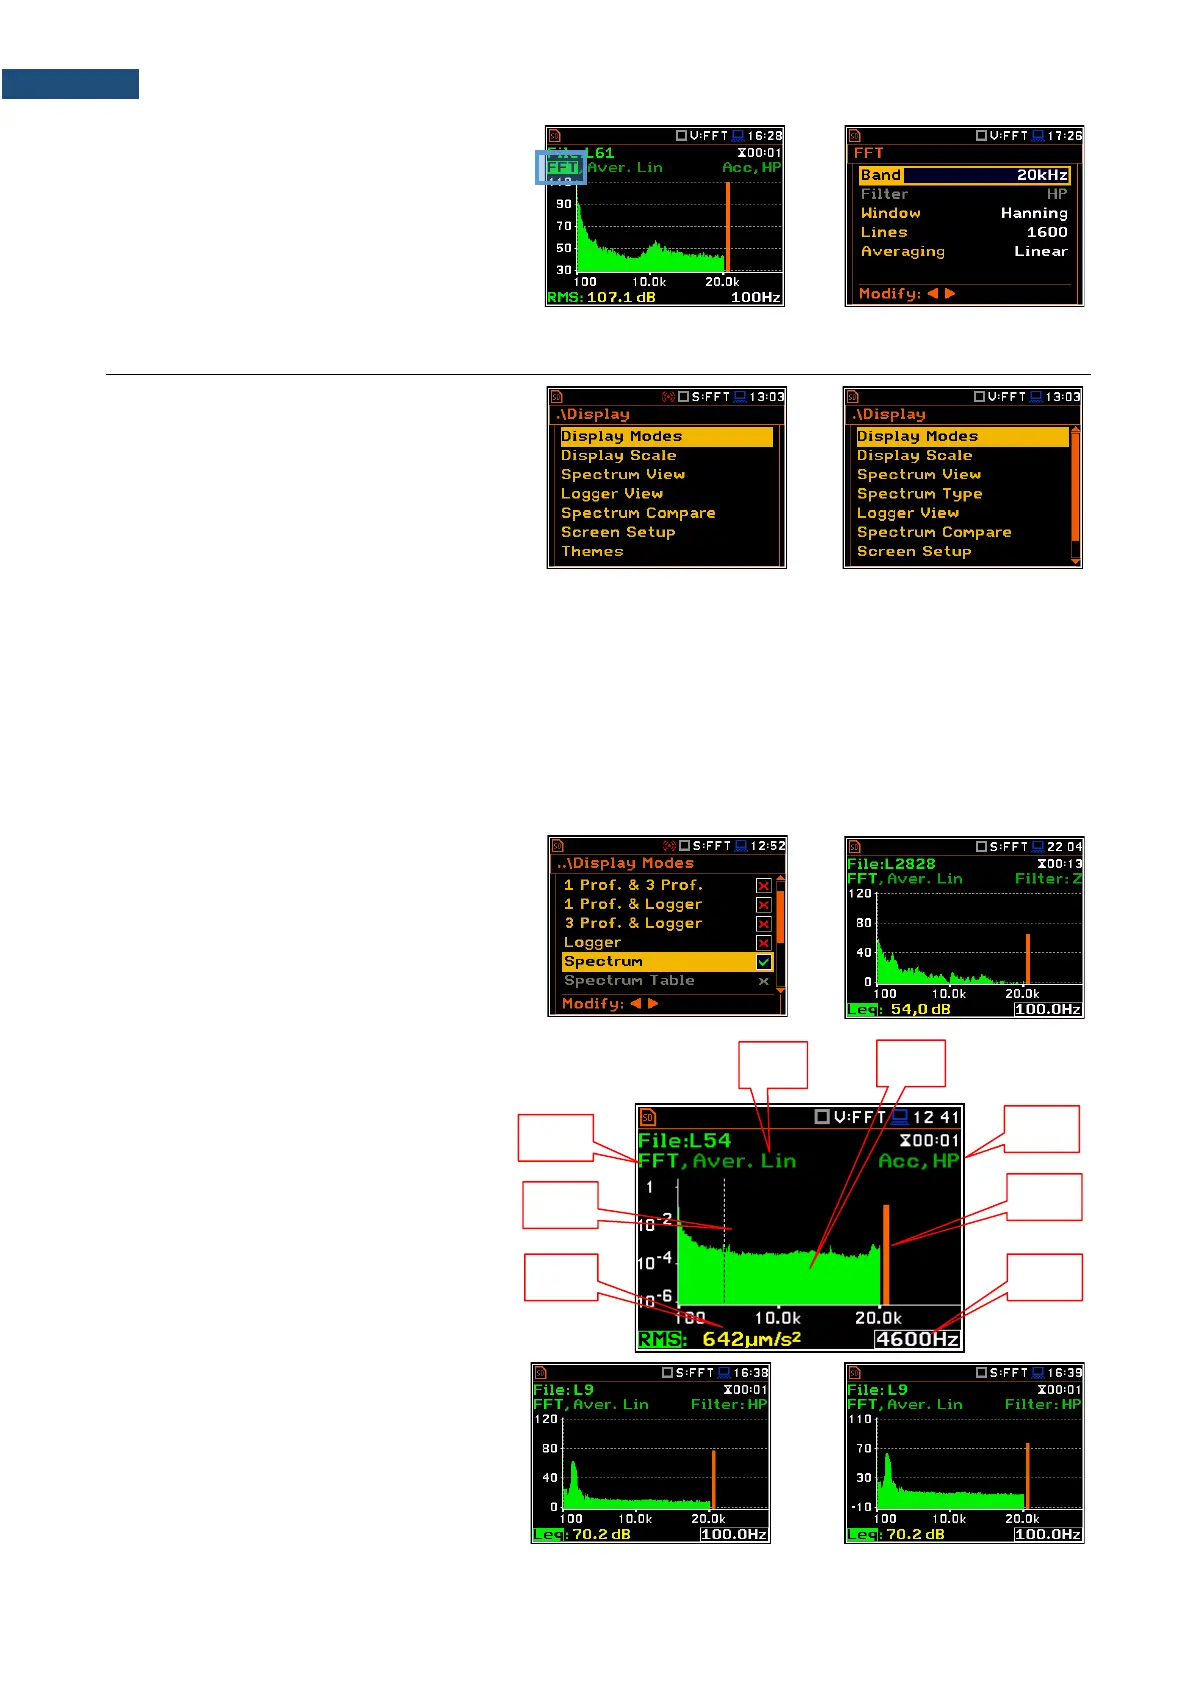
You can easily get into the FFT screen from
the spectrum view. It is necessary to enter
the function field (FFT) with the ▲ / ▼ key
and press <ENTER>.
11.3 CONFIGURING FFT SPECTRA VIEW
The Display section contains elements for
programming measurement result
presentation and display parameters.
Following positions are used for setting up
the presentation of FFT results:
Display Modes allowing you to switch on the Spectrum view;
Display Scale allowing you to adjust scales of a spectrum plot and toggle the grid;
Spectrum View allowing you to select spectra to be viewed: instantaneous, averaged, maximum or
minimum;
Spectrum Type allowing you to change the spectrum type presented on the display in vibration modes:
acceleration, velocity or displacement. This position appears in the vibration modes.
11.3.1 Presentation of FFT spectra
Spectrum plot view
The Spectrum position in the
Display Modes list becomes available for
the FFT function. It enables/disables the
spectrum plot view.
Spectrum view fields
1. Analyser function
2. Cursor position
3. Value for the cursor position
4. Averaging used
5. Spectrum plot
6. Frequency weighting filter
7. Total value
8. Line frequency for the cursor position
You can shift the Y-axis in the spectrum view
with the <Shift> and ▲ / ▼ keys pressed
together.