It is possible to select the range from the set:
10dB, 20dB, 40dB, 80dB, 100dB and
120dB.
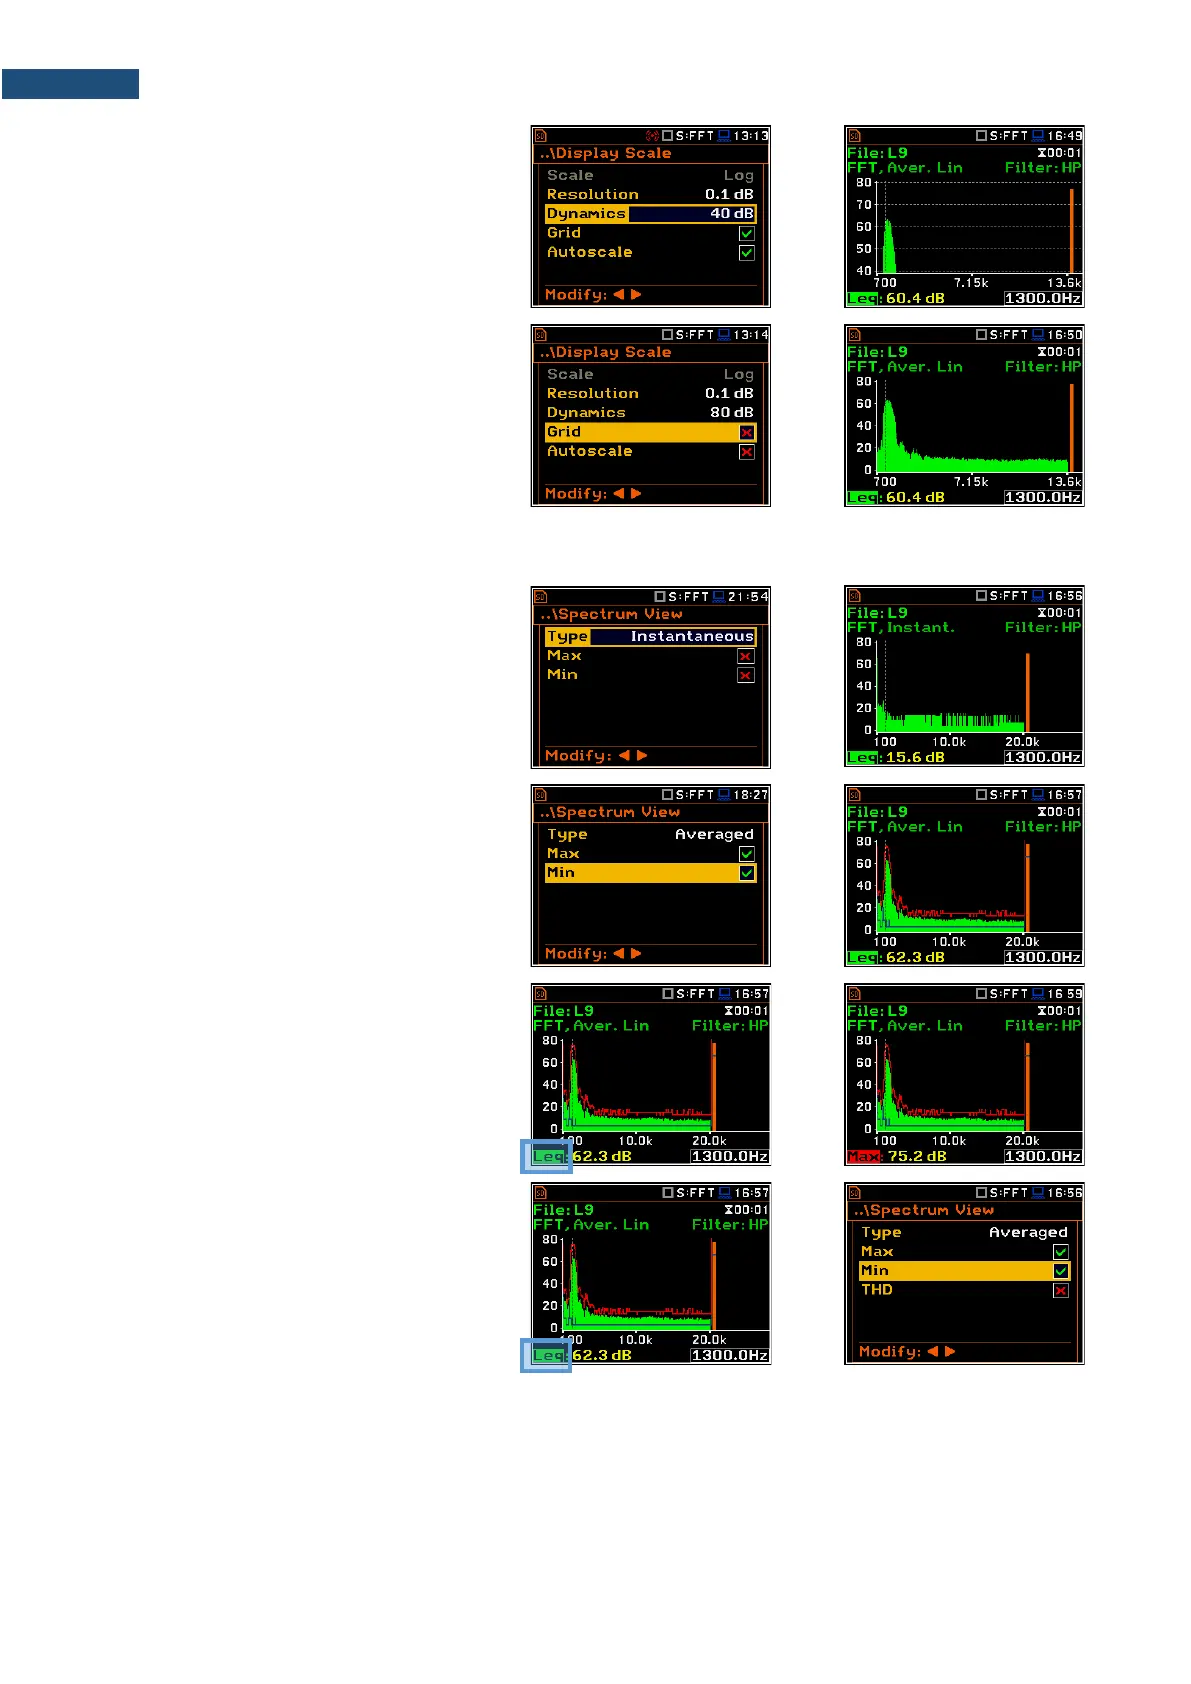
Toggling the grid
The Grid position allows you to toggle the
horizontal grid lines of the logger or
spectrum plot.
11.3.3 Selection of spectra to be viewed – Spectrum View
In the Spectrum View screen, you can
select the different spectra to be viewed in
the Spectrum display mode: Averaged,
Instantaneous, Max or Min.
When the Averaged or Instantaneous
spectrum is selected, you can additionally
switch on or off the presentation of the Max
and/or Min values by switching the Max or
Min parameters on.
To enable to read the Max or Min values at
the cursor position, select the field in the
lower left-hand corner of the display with the
▲ / ▼ key. Then select the appropriate
value with the ◄ / ► key pressed together
with <Alt>.
You can easily get into the Spectrum View
screen from the Spectrum view by entering
the result field (Leq/RMS) with the ▲ / ▼
key and pressing <ENTER>.