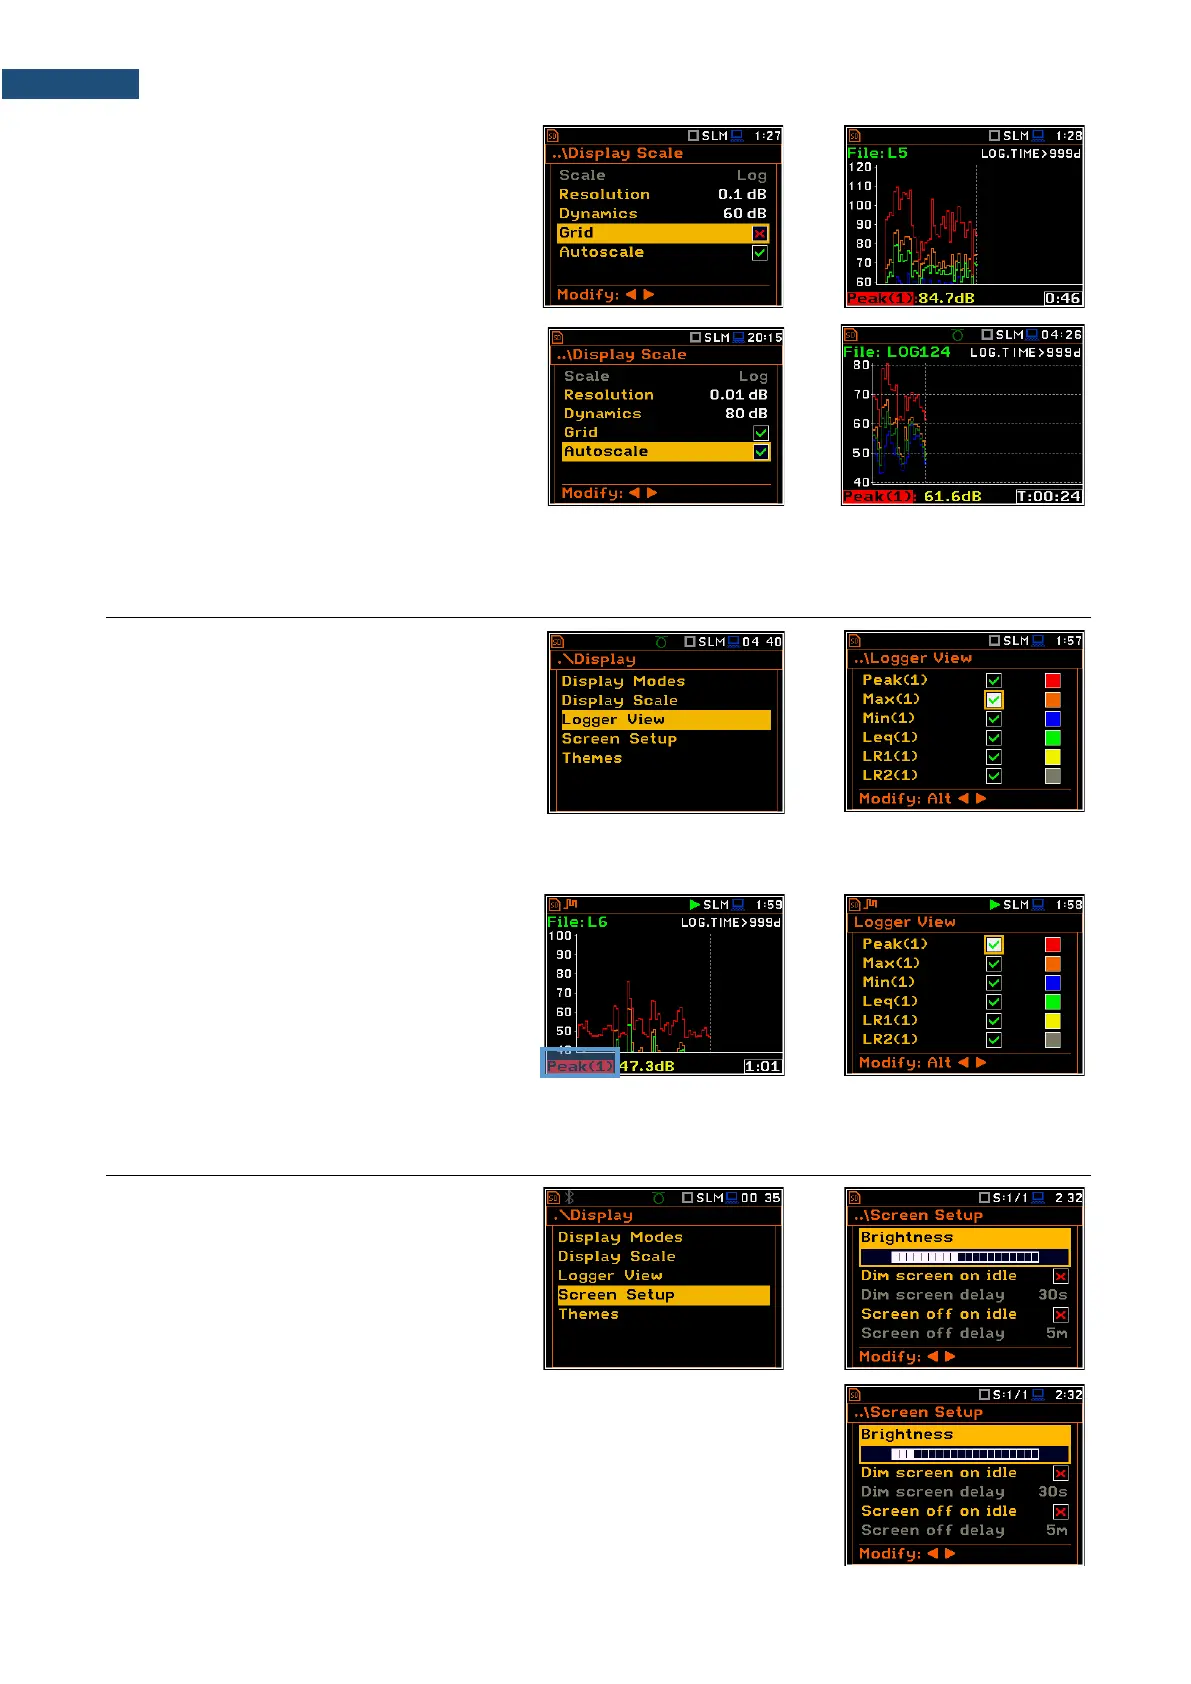
Toggling the grid
The Grid position allows you to switch on or
off the horizontal grid lines of the logger or
spectrum plot.
Toggling the automatic Y-scale
adjustment
The Autoscale position toggles the
automatic adjustment of the Y-axis
dynamics to the measured result level. The
adjustment is performed automatically once
after the start of the measurement to suit the
initial level of the input signal from the
microphone or accelerometer.
5.3 ADJUSTING LOGGER VIEW – LOGGER VIEW
The Logger View screen allows you to
adjust the Logger view by choosing logged
results to be displayed and colours of their
curves.
Every logger curve shows the history of one
result measured in a profile, like Peak(1). In
the Logger View screen, you can include or
exclude the curve from the logger plot (first
column) and define the colour of this curve
(second column).
The view of the logger screen can be
adjusted quickly without stopping the
measurement. Highlight the function label in
the bottom left hand corner then press
<ENTER>. The Logger View list will be
displayed in which you can make necessary
adjustments and return to the Logger view
after confirmation of the performed changes
with the <ENTER> key.
5.4 CONFIGURING DISPLAY BRIGHTNESS AND POWER SAVER – SCREEN SETUP
The Screen Setup screen allows you to set
up the brightness of the display and to toggle
the power saver.
Brightness of the display
The Brightness position allows you to set the proper brightness of the display
with the ◄ / ► key. You can select 20 different values of this parameter. The
new value of brightness level is confirmed after each press of the ◄ / ► key.