The instrument operates as the FFT analyser in a very similar way to the Level Meter. Moreover, the FFT
analysis is performed in parallel with the SLM or VLM measurements.
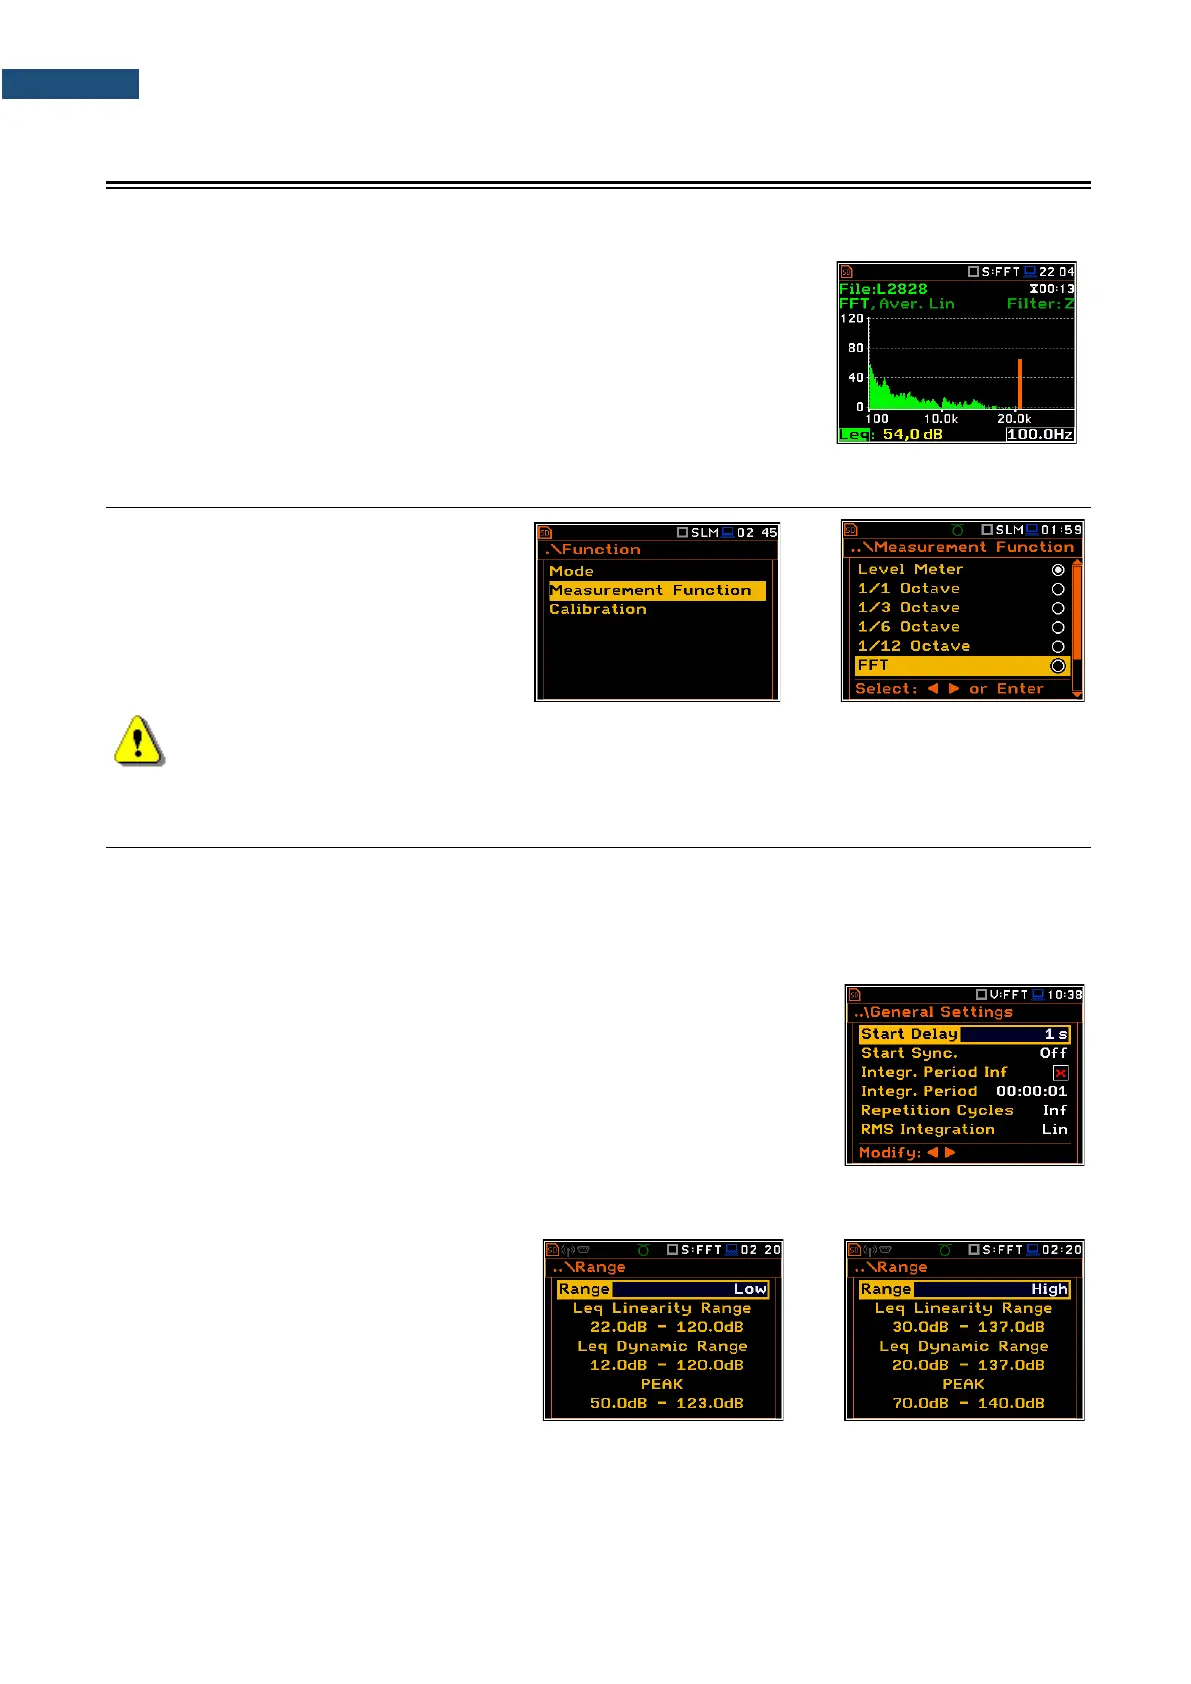
Results of the FFT analysis (spectra) measured with preselected frequency
weighting filter and window, are presented in the Spectrum view.
The read-out of spectrum values can be done with a vertical cursor.
11.1 SELECTING FFT FUNCTION
To select the FFT analysis function, open
the Measurement Function screen, select
the FFT position and press <ENTER>.
Note: It is not possible to change the current function during a running measurement.
In this case, the instrument displays for about 2 seconds the message: “Measurement in Progress”.
To change the current function, the measurement must be stopped!
11.2 CONFIGURING FFT ANALYSER
Execution of the FFT analysis depends on a certain number of the parameters, configured in the Measurement
section.
11.2.1 General measurement settings of FFT analysis – General Settings
FFT spectra are averaged during Integration Period and saved as
Summary Results the number of times specified by the Repetition Cycles
parameter.
The Integration Period and Repetition Cycles parameters are defined in the
General Settings list.
11.2.2 Selecting measurement range for FFT analysis – Range
The input range for the FFT function can be
selected in the Range screen: Low or High.
Depending on the settings of the Scale
parameter (path: <Menu> / Display /
Display Scale) the range for a vibration
signal can be presented in absolute or
logarithmic units (dB).
The values of ranges in sound modes depend on the settings made in the Compensation Filer screen (path:
<Menu> / Measurement / Compensation Filter).