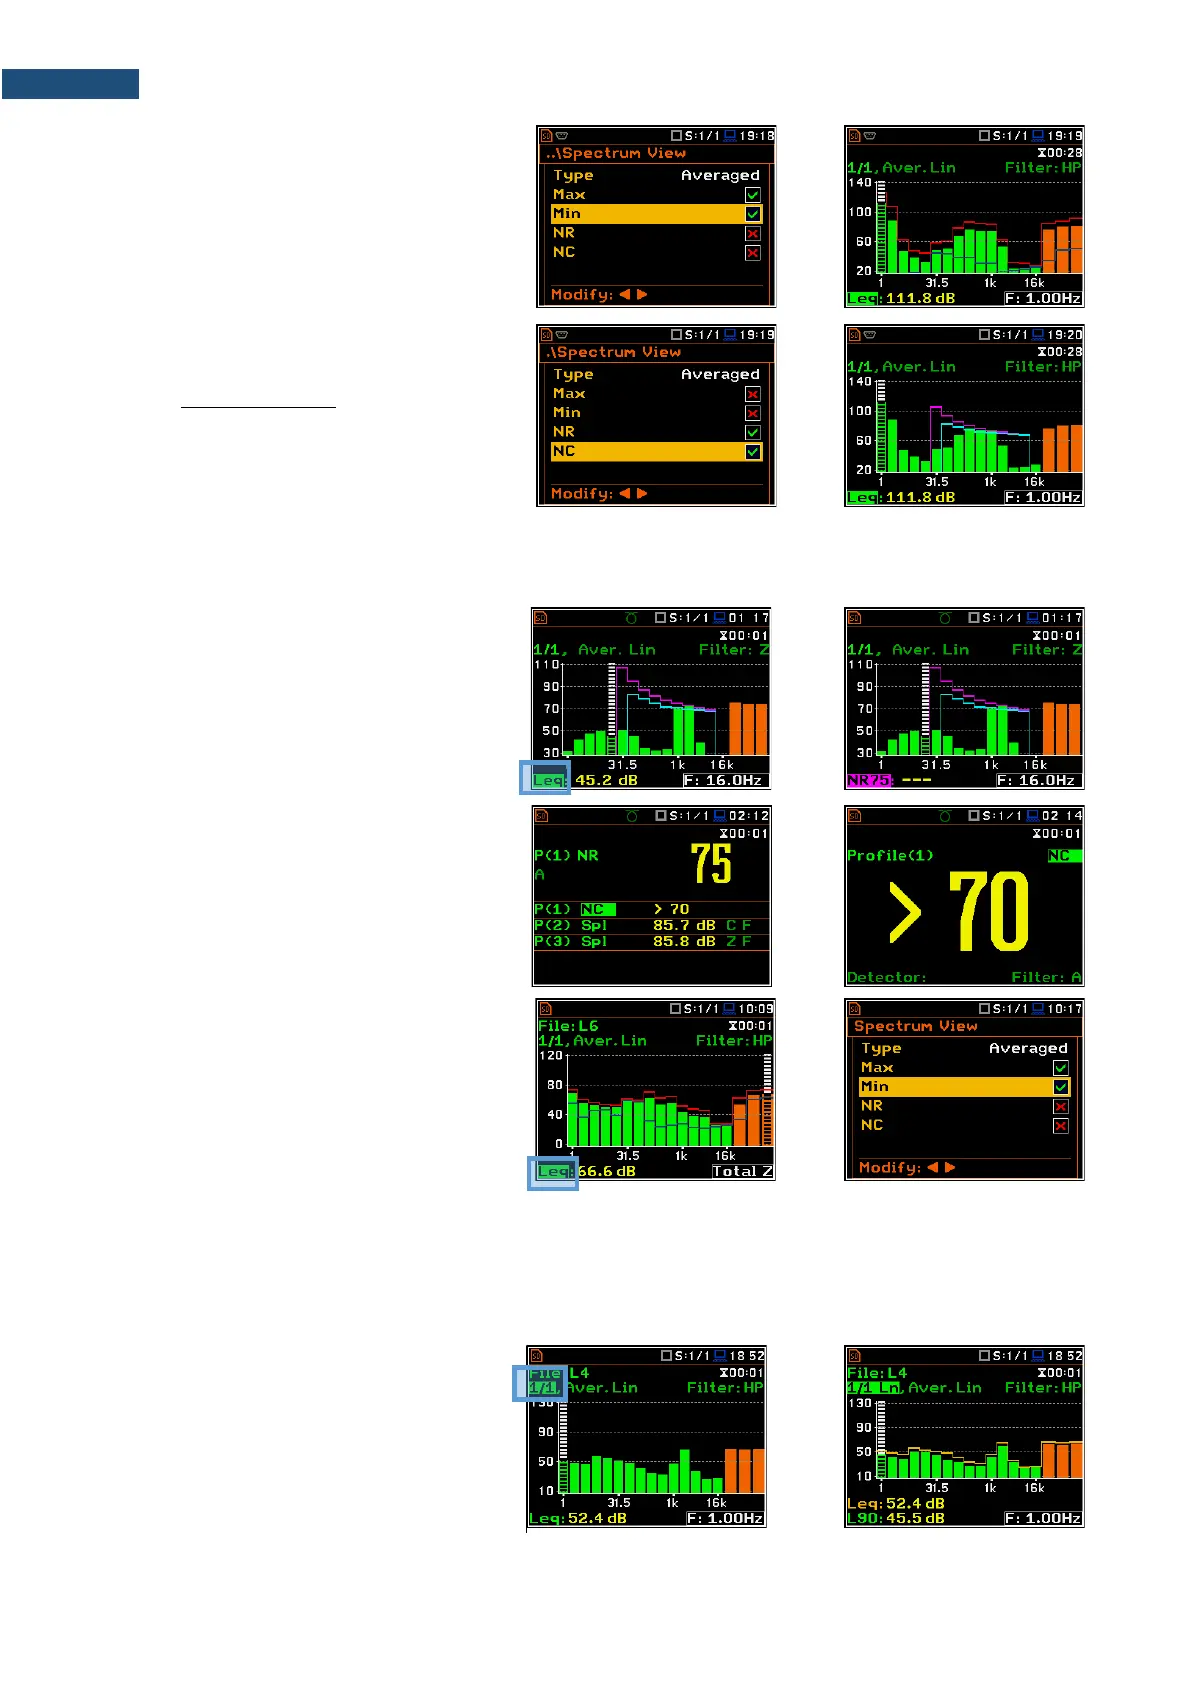
When the Averaged or Instantaneous
spectrum is selected, you can additionally
enable presentation of the Max and/or Min
values for each band by switching the Max
or Min parameters on.
The Max and Min spectrum is presented as
a stepped line – red and blue colour.
NR and NC results view
In case of 1/1 octave Sound measurements
(S:1/1) with HP or Z filter, noise rating (NR)
and noise criterion (NC) values can be
additionally presented on the same plot as a
main spectrum when the NR or/and NC
parameter is enabled.
A violet line shows the NR results for the octave bands with central frequencies: 31.5Hz, 63.0Hz, 125Hz, 250Hz,
500Hz, 1.00kHz, 2.00kHz, 4.00kHz and 8.00kHz. A blue line shows the NC results for the octave bands with
central frequencies: 63.0Hz, 125Hz, 250Hz, 500Hz, 1.00kHz, 2.00kHz, 4.00kHz and 8.00kHz.
To enable the cursor to read the Max, Min,
NR or NC values, select the result field in the
lower left-hand corner of the display with the
▲ / ▼ key. Then select the appropriate
value with the ◄ / ► key pressed together
with <Alt>.
The NR or NC results can be seen also in
the 1 Profile and/or 3 Profile modes.
If the NC or NR result exceeds the maximum
value for which the curves are defined
(NC=70 or NR=130) then before the
displayed result the character (>) appears
and the highest defined curve is displayed.
You can easily get into the Spectrum View
screen from the Spectrum view to change
viewed spectra by selecting the result field
in the lower left-hand corner of the display
with the ▲ / ▼ key and pressing <ENTER>.
10.3.4 Spectrum statistics
The instrument calculates statistics in Sound modes for all 1/1 - 1/12-octave bands as well as for Total results
based on 100 ms Leq results. Special Ln spectrum view presents Lnn results for all 1/1 - 1/12-octave bands
and Totals.
To view statistics for the selected band you
should:
1. Select the 1/1 - 1/12 field with the ▲ /
▼ key.
2. Activate the Ln spectrum view,
changing the field content to the 1/1 Ln
- 1/12 Ln with the ◄ / ► key pressed
together with <Alt>.