155
ANALYZING TOMOGRAMS
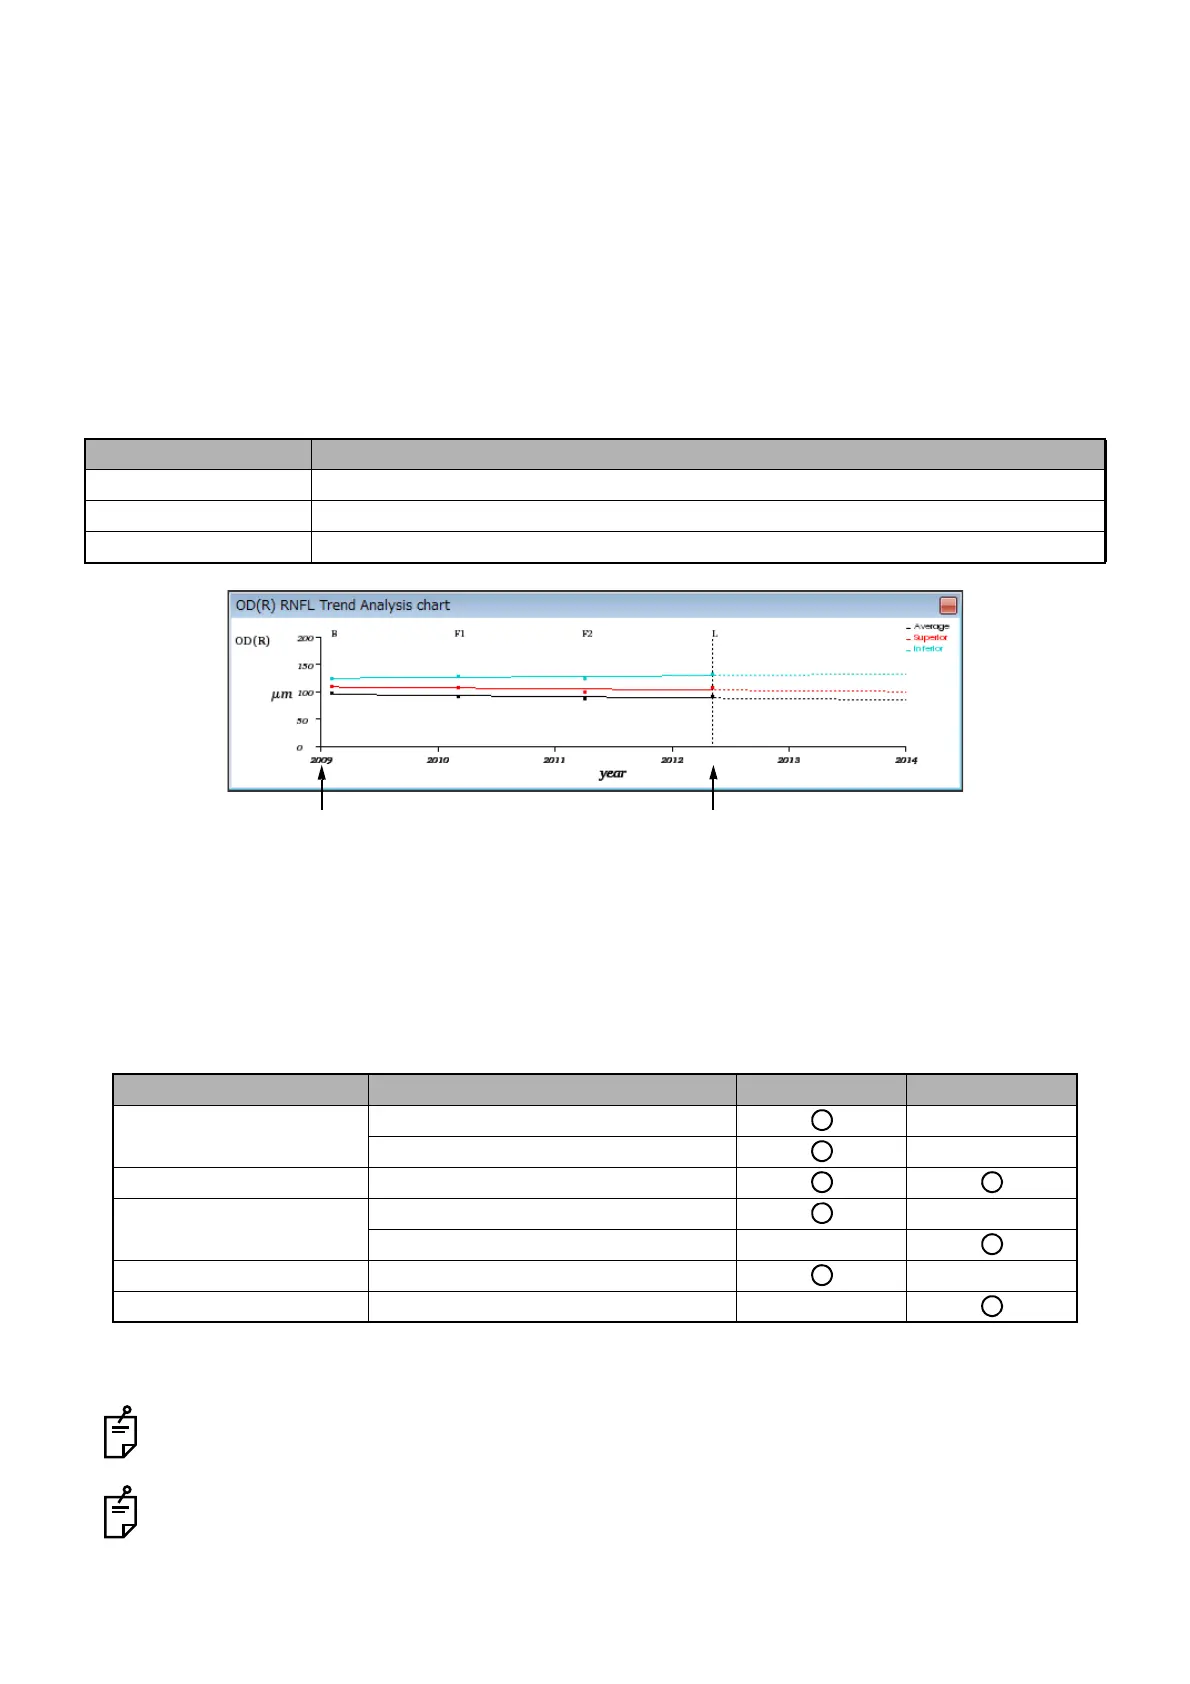
How to see the trend analysis result graph
• The trend analysis result graph shows the change trend in each layer data from "Baseline" (the oldest
shooting date) to "Latest" (the newest shooting date) as mentioned below.
- When the period is four years or less, the data from "Baseline" to the date after five years are displayed.
- When the period is five to nine years, the data from "Baseline" to the date after ten years are displayed.
- When the period is ten to nineteen years, the data from "Baseline" to the date after twenty years are dis-
played.
- When the period is twenty years or more, the data from "Latest" to the date after ten years are dis-
played.
• The date and each layer data are plotted on the X axis and Y axis respectively. The following informa-
tion is displayed.
The oldest data are plotted on "BaseLine". The newest data are plotted on "Latest". Each dotted line
after "Latest" is the extended primary regression line, which does not mean the prediction in the future.
Items that can be displayed by [Overlay control]
The items that can be displayed on the fundus image are shown below.
* On "Thickness map", "Significance map" and "Symmetry map" of "3D: Macula (V)", it is possible to
change the layers with the [RNFL], [GCL++] and [GCL+] buttons on the tool bar.
"Grid" and "Significance map" cannot be displayed at the same time. When "Thickness map" and
"Significance map" are displayed at the same time, "Significance map" is over "Thickness map".
In the case of "3D: Macula (V)", the layers, which are the objects of "Thickness map/Significance
map", can be changed with the buttons on the tool bar.
Name Function
Average graph The average value of each layer data is plotted.
Superior graph The average value of "S" area in each layer data is plotted.
Inferior graph The average value of "I" area in each layer data is plotted.
Type Item 3D: Optic disc 3D: Macula (V)
Grid Circle Grid 4 sector -
Circle Grid 12 sector -
Thickness map -
Significance map 24×24 grid -
10×10 grid -
Analysis Disc Topography -
Symmetry map - -
Base line Latest
Trend analysis result graph