Ethernet Performance Monitoring Monitoring
NOTE: Graphs may slow down PC operation due to lack of resources.
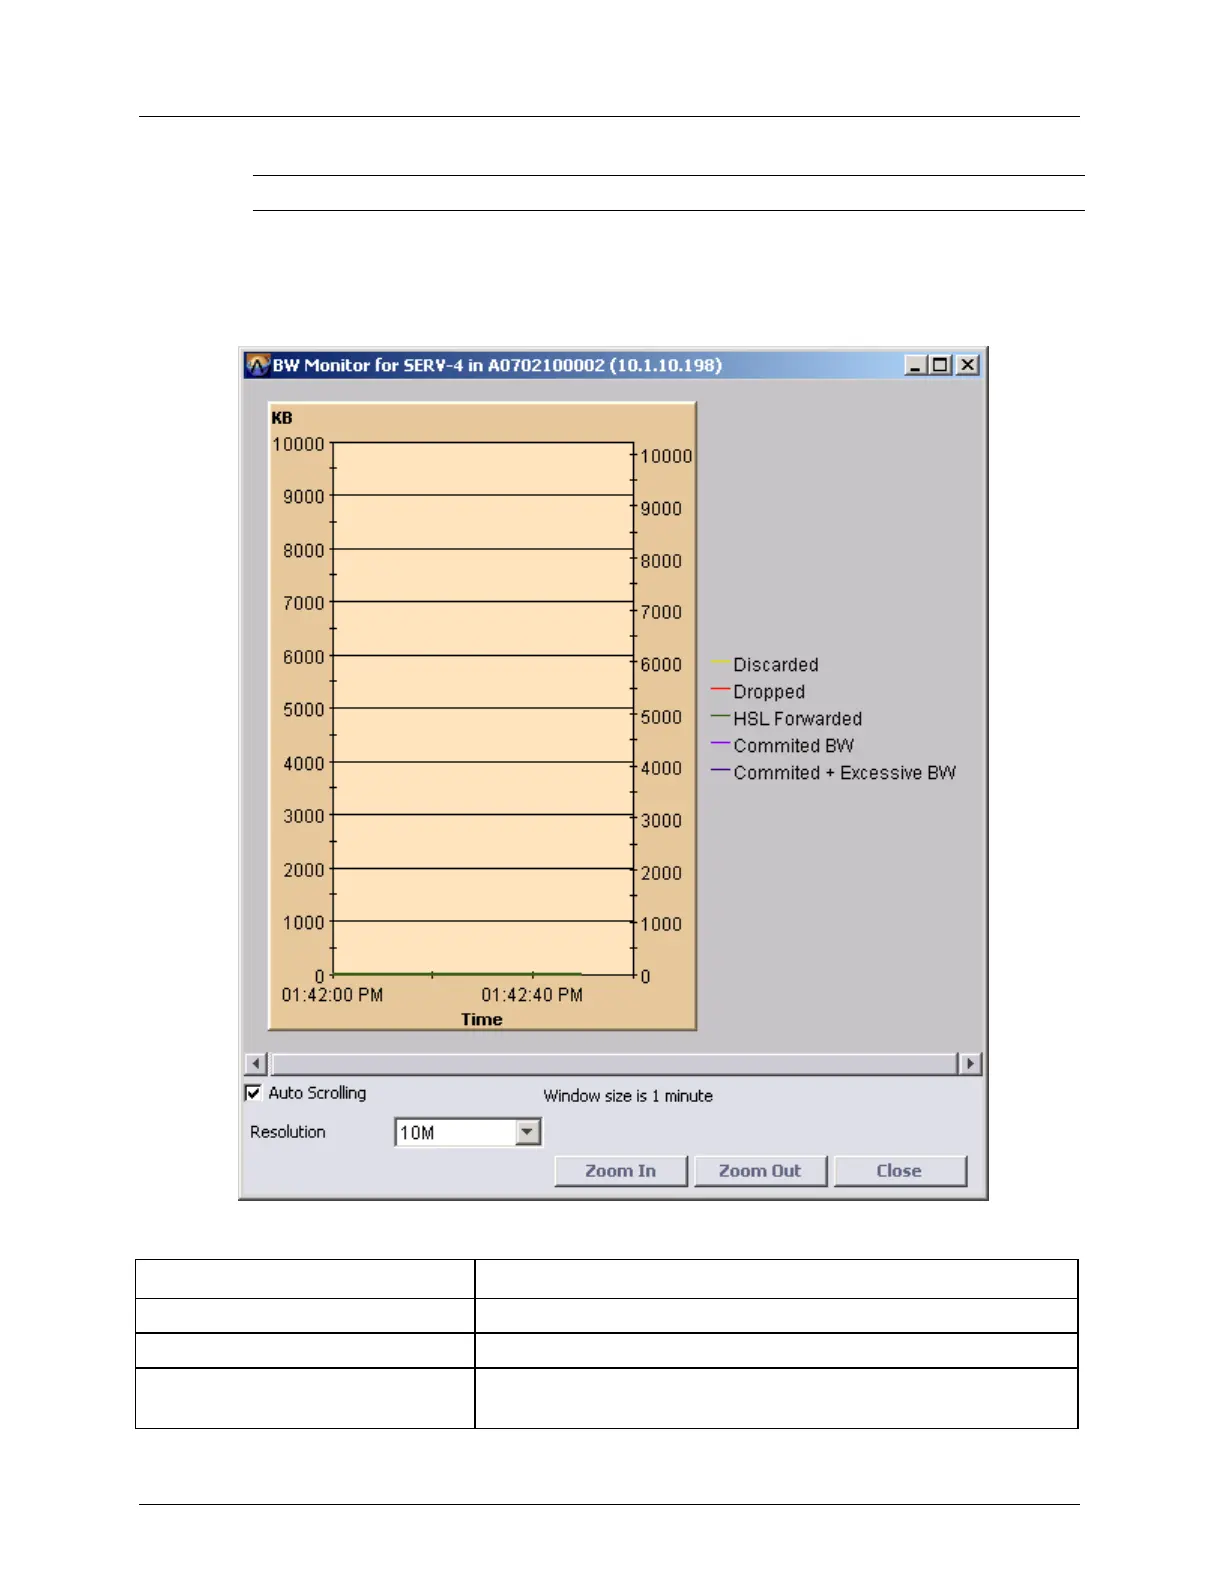
To display the graph:
In the Network Element tree, open Ethernet Services, Service BW Monitor. The Service
BW Monitor pane opens. On the table, select a row. Click View Graph. The BW Monitor
for <Port> dialog appears.
Table 72: Navigating the Graphical Display
Clear the Auto Scrolling check box.
From the Resolution list box, select the BW scaling
Select Tx, Rx or Both, from the
Series selection list box
Select the appropriate option