Equipment and Port Configuration Ethernet Port
Ethernet Port Workspace
Several views are available for Ethernet ports configuration, monitoring and analysis. Each
view has a dedicated set of monitoring and configuration buttons, where some of the options
are common to the different views (the left pane in each view shows how the view is
accessed).
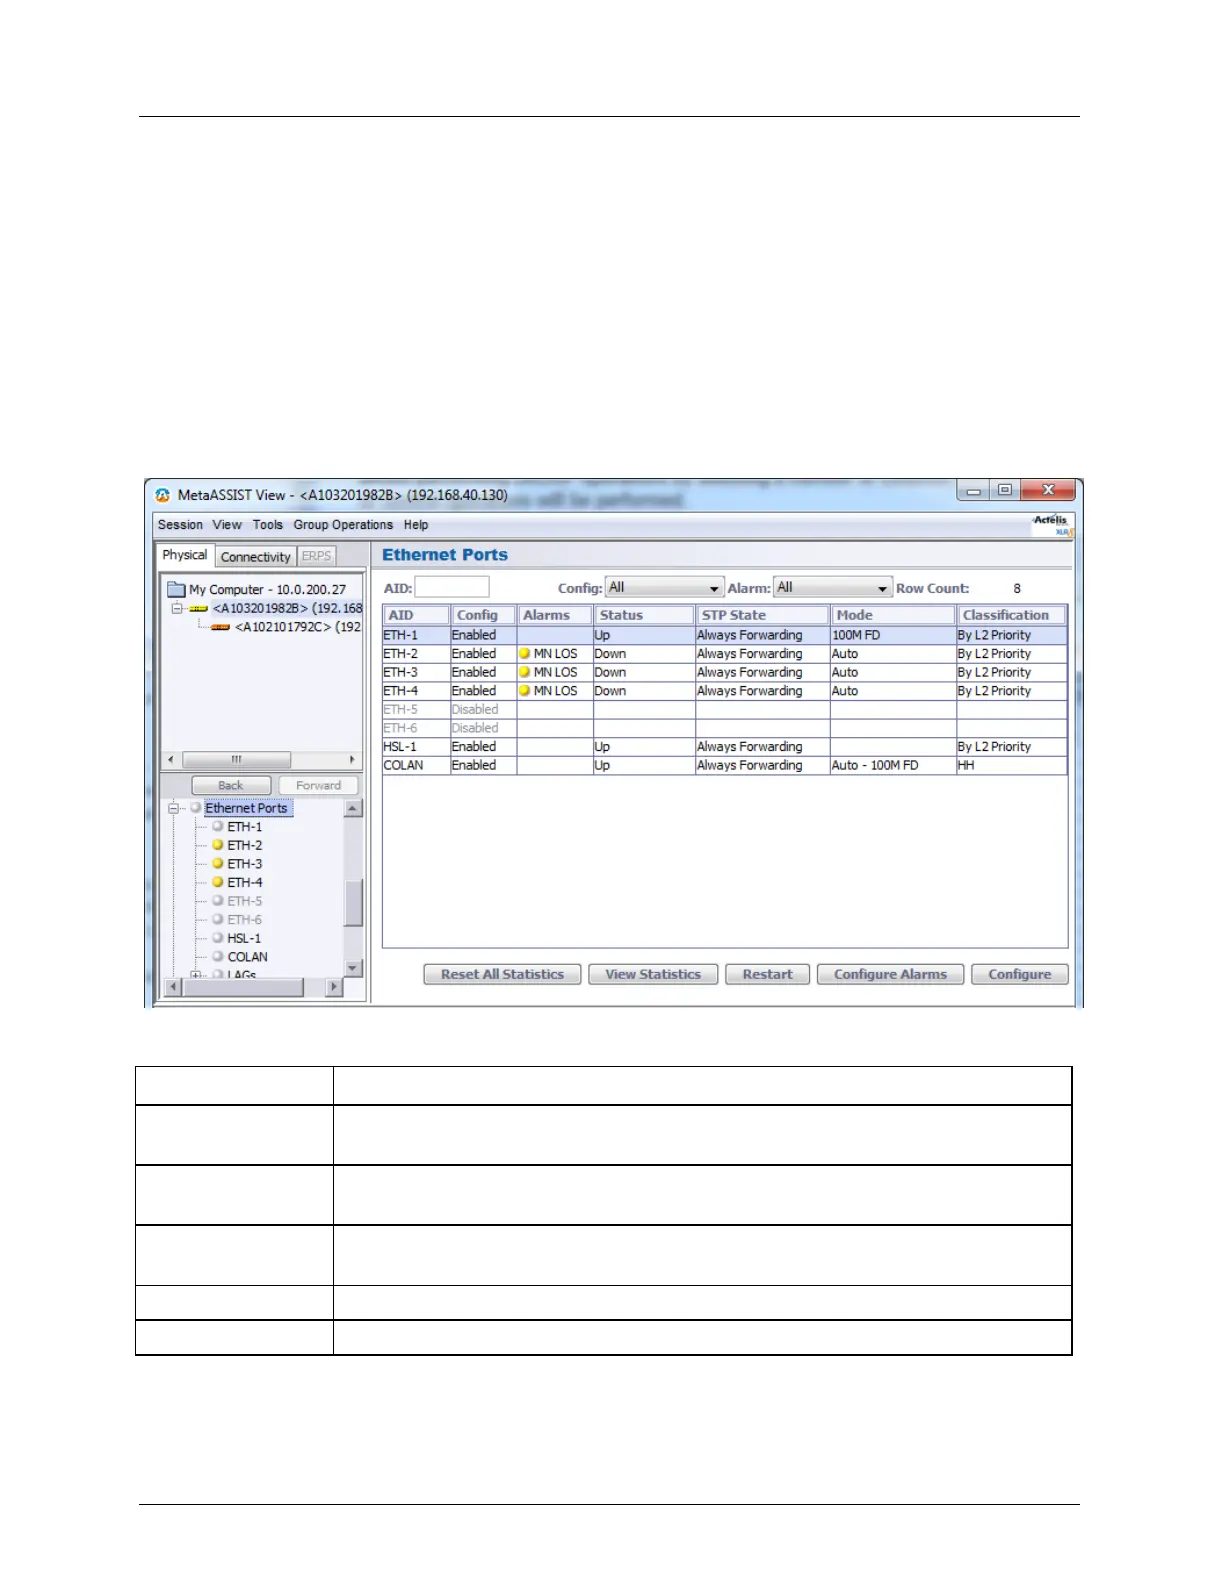
Ethernet Glance View - lists all the Ethernet ports and their attributes in tabular format. In
addition, the pane allows performing GROUP operations by selecting a number of
Ethernet ports on which the desired configuration or control operations will be
performed.
Table 14: ML700 Workspace
Resets the statics and trigger values for ALL ports (individual port statistics can
be reset through their dedicated View Statistics pane)
View Statistics (on
page 13-26)
Displays a detailed performance monitoring pane showing statistics on traffic
(Tx and Rx frames, dropped frames, etc.)
Resets the port. This may cause a momentary disruption in the service associated
with that port
Alarm configuration for the selected port
Displays the Ethernet port configuration dialog