Monitoring Ethernet Performance Monitoring
Traffic statistics in each direction on the link
Information on the VLANs, EVC configuration and EVC statistics
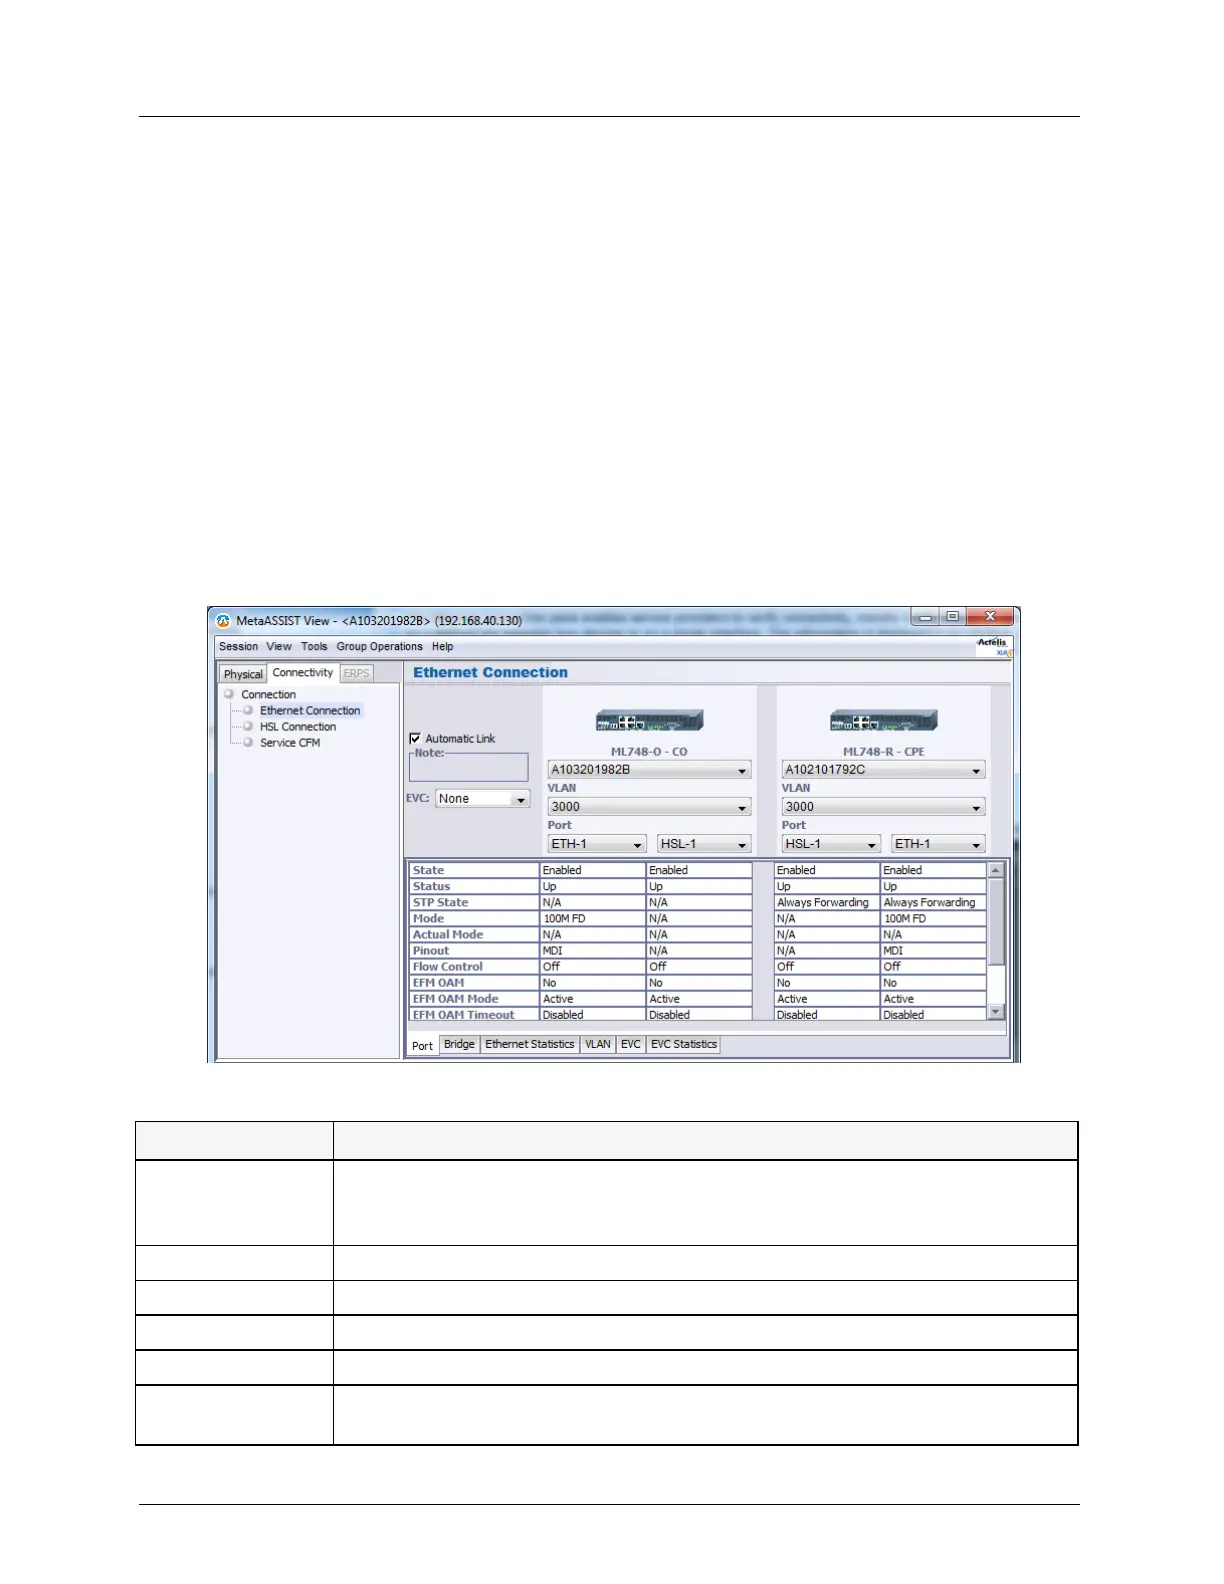
To invoke and navigate the Ethernet Connectivity tab
In the Main window, click the Connectivity tab and click Ethernet Connection. The
Ethernet Connections pane is invoked.
The pane is divided into the following areas:
NE 1 and NE 2 - shows the NEs whose interfaces or interconnection is to be analyzed.
For each NE, the IP, VLANs and interfaces are displayed. The display is affected by the
setting of the Automatic Link option.
Automatic Link - This option is ENABLED by default - selecting any item (IP address,
VLAN or Port), automatically displays all the associated items on both NEs. If Automatic
Link is DISABLED, each item stands on its own. If it is modified, the associated items do
not change accordingly. This enables analyzing each element on its own.
Tabs at the bottom of the pane provide a range of detailed analysis options.
Table 74: Ethernet Connectivity Tabs
Shows the configuration and status of an individual interface or two interfaces
comprising a link (according to the selected option and whether Automatic Link
is enabled)
Shows Bridge level configuration and status for each of the defined NEs
Shows traffic flow on the link or on a single interface in the selected direction
Shows the Port Membership and Tag for each VID, for each displayed NE
Shows the configuration for selected EVC
Quantifies various statistics for selected EVC. Selected statistics can be displayed
as graphs.