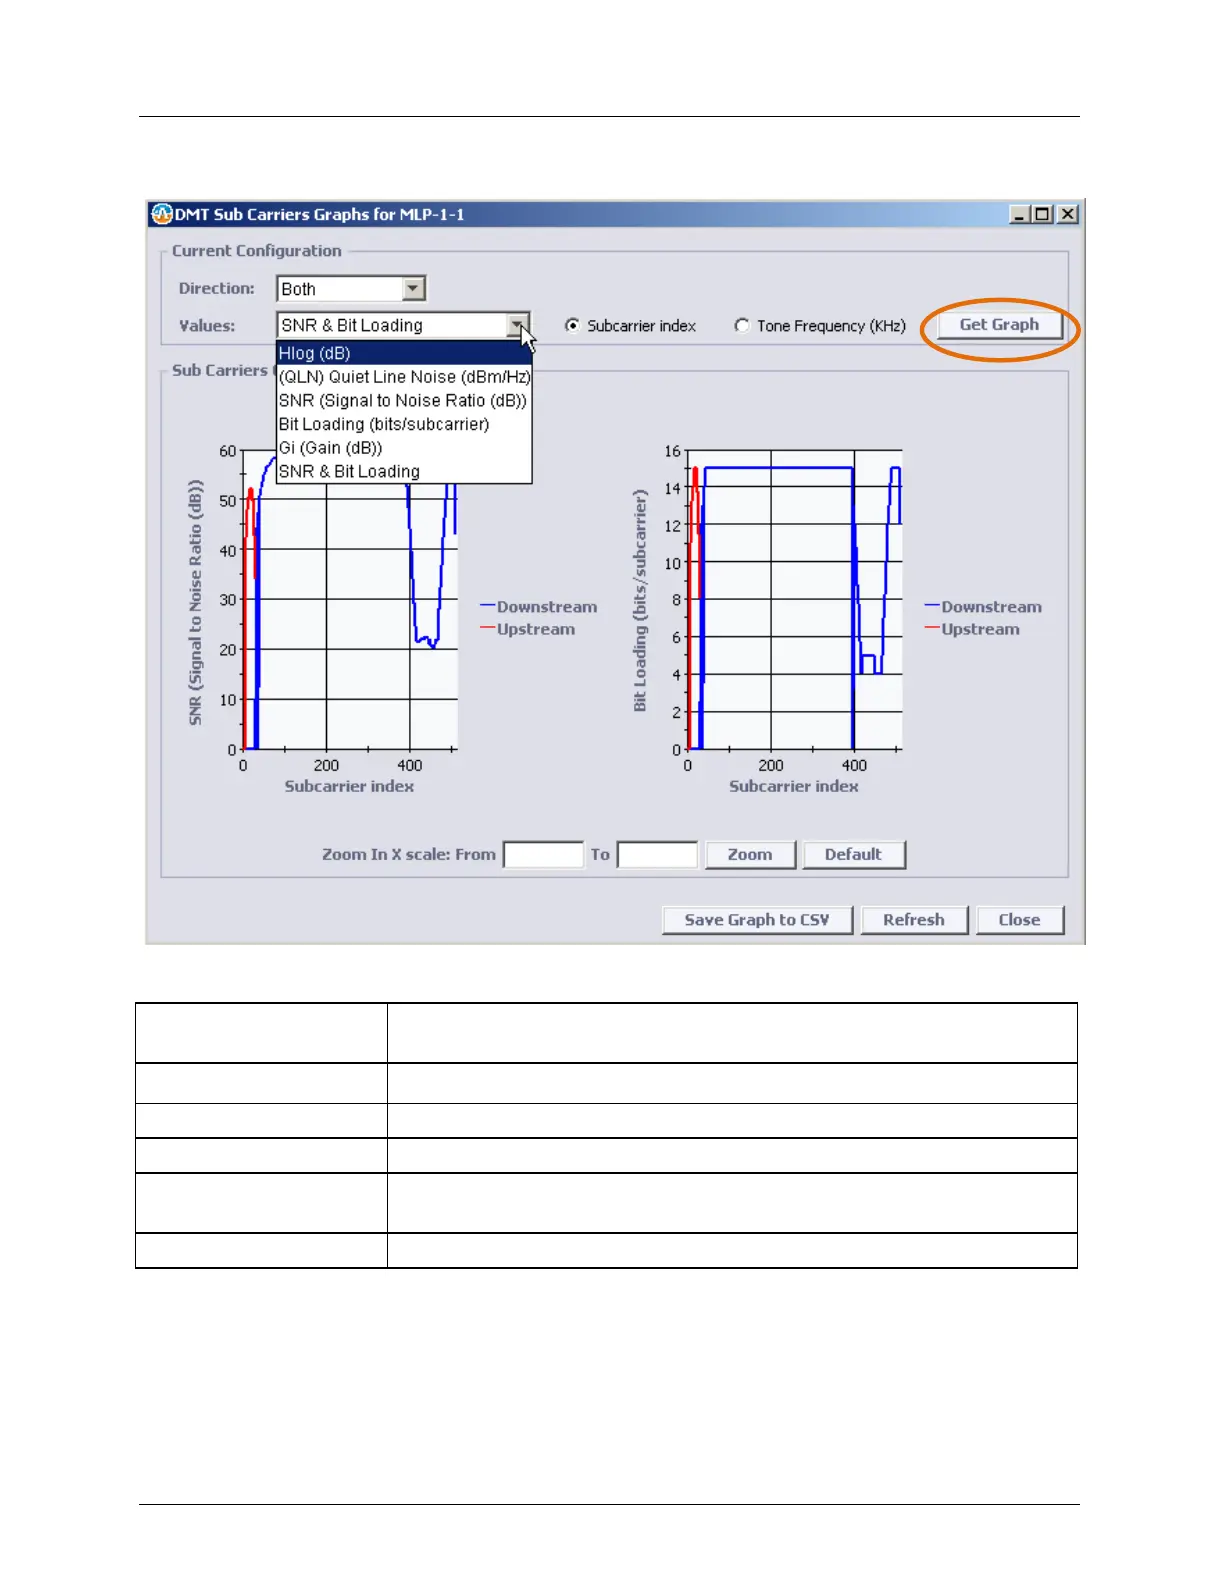
Copper Line Monitoring Monitoring
You can zoom in the graph as well as save the graph to a tabular format.
Table 83: Graph Attributes
Upstream data only, Downstream data only or Both (Upstream and
Downstream)
Type of graph parameters as detailed in the following table.
X-scale according to sub-carrier index
X-scale according to tone frequencies
Zoom into the graph for a larger display according to the defined Zoom In
X Scale
Save graph in tabular form