2 • DC Description
Doc. 065031-04 1/08 63
2.16.5 Cyclic Voltammetry Detection
The determination of the optimum potentials to use in amperometry
begins with an electrochemical technique called voltammetry, in which
the current that results from oxidation or reduction reactions is measured
against the voltage applied to the system. The applied voltage is changed
(scanned) within preset limits.
In cyclic voltammetry, the voltage is first scanned in one direction and
then reversed so that the voltage at the end of the scan is the same as at the
beginning. This results in a triangular waveform (see Section 2.16.6
).
In the cyclic voltammetry mode, the detector measures the current at a
rate of 1 KHz (i.e., 1000 raw data points per second are collected). The
data is compressed before storage to 20 Hz.
2.16.6 Waveforms
A waveform is a series of steps, defined as points on a plot of potential vs.
time. Waveforms must be defined for the cyclic voltammetry and
integrated amperometry modes.
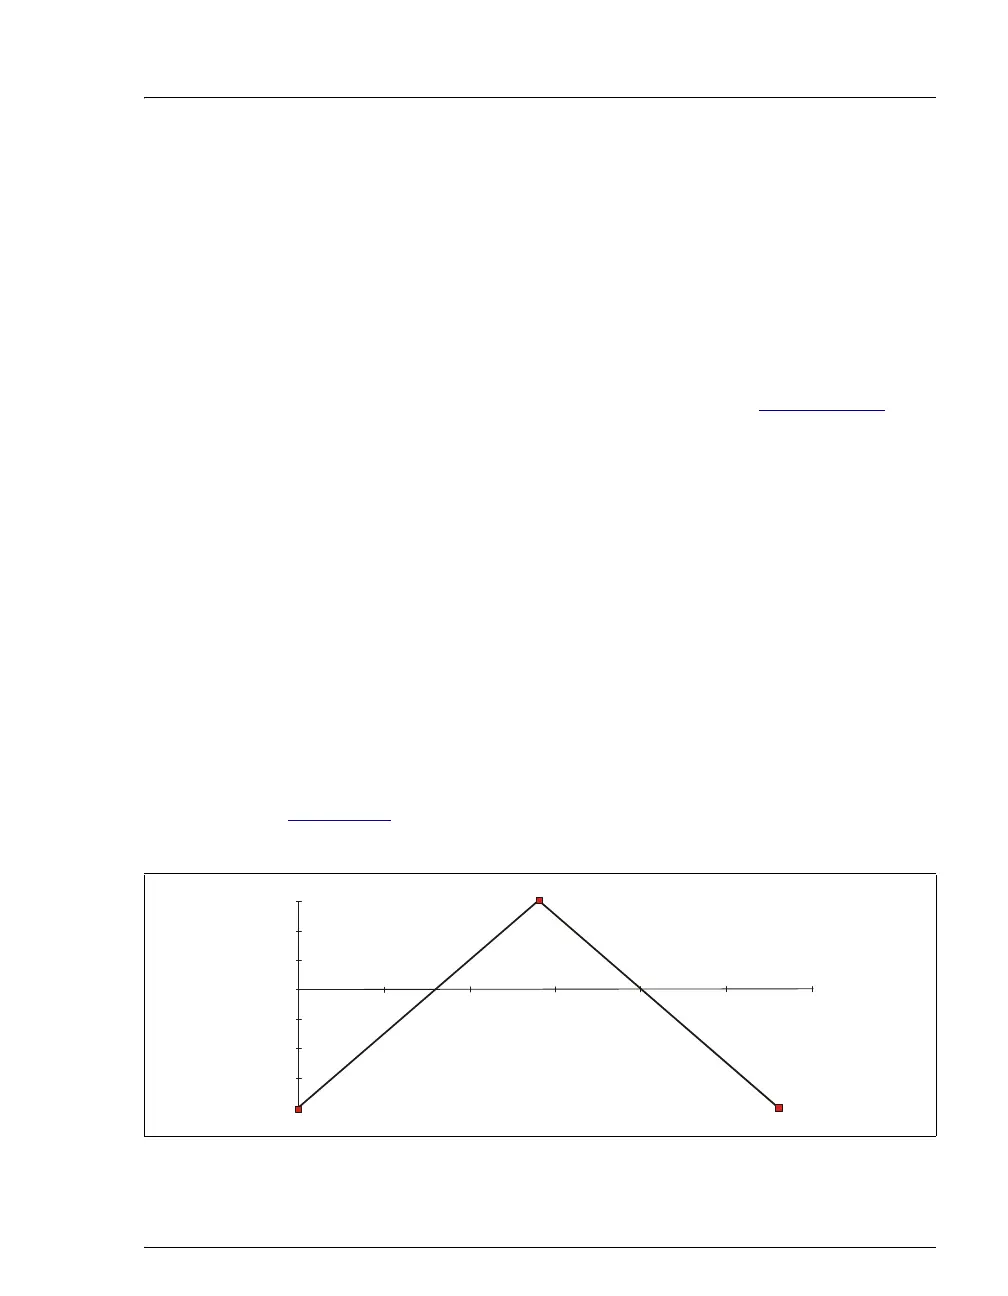
Cyclic Voltammetry Waveforms
Cyclic voltammetry waveforms consist of three steps, each with a time
and a potential. The waveform forms a triangle, with the first step always
at time zero and the first and third steps always having the same potential.
Figure 2-26
shows an example of a triangular waveform used in cyclic
voltammetry.
Figure 2-26. Example Cyclic Voltammetry Waveforms
n
0.60
olts
0.40
0.20
-0.20
-0.40
-0.60
-0.80
0.00 5.00 10.00 15.00 20.00 25.00 30.00
(28.0, -0.80)
14.0, 0.60
(0.00, -0.80
0.00