Stress Echo
7-22 Vivid S70 / S60 – User Manual
BC092760-1EN
01
Accessing QTVI Stress analysis tools
The three QTVI Stress analysis tools are entered by pressing a
dedicated button on the scoring diagram (Figure 7-10) of the
selected view. Only views with TVI data acquired will display
QTVI Stress tools buttons on the respective diagrams.
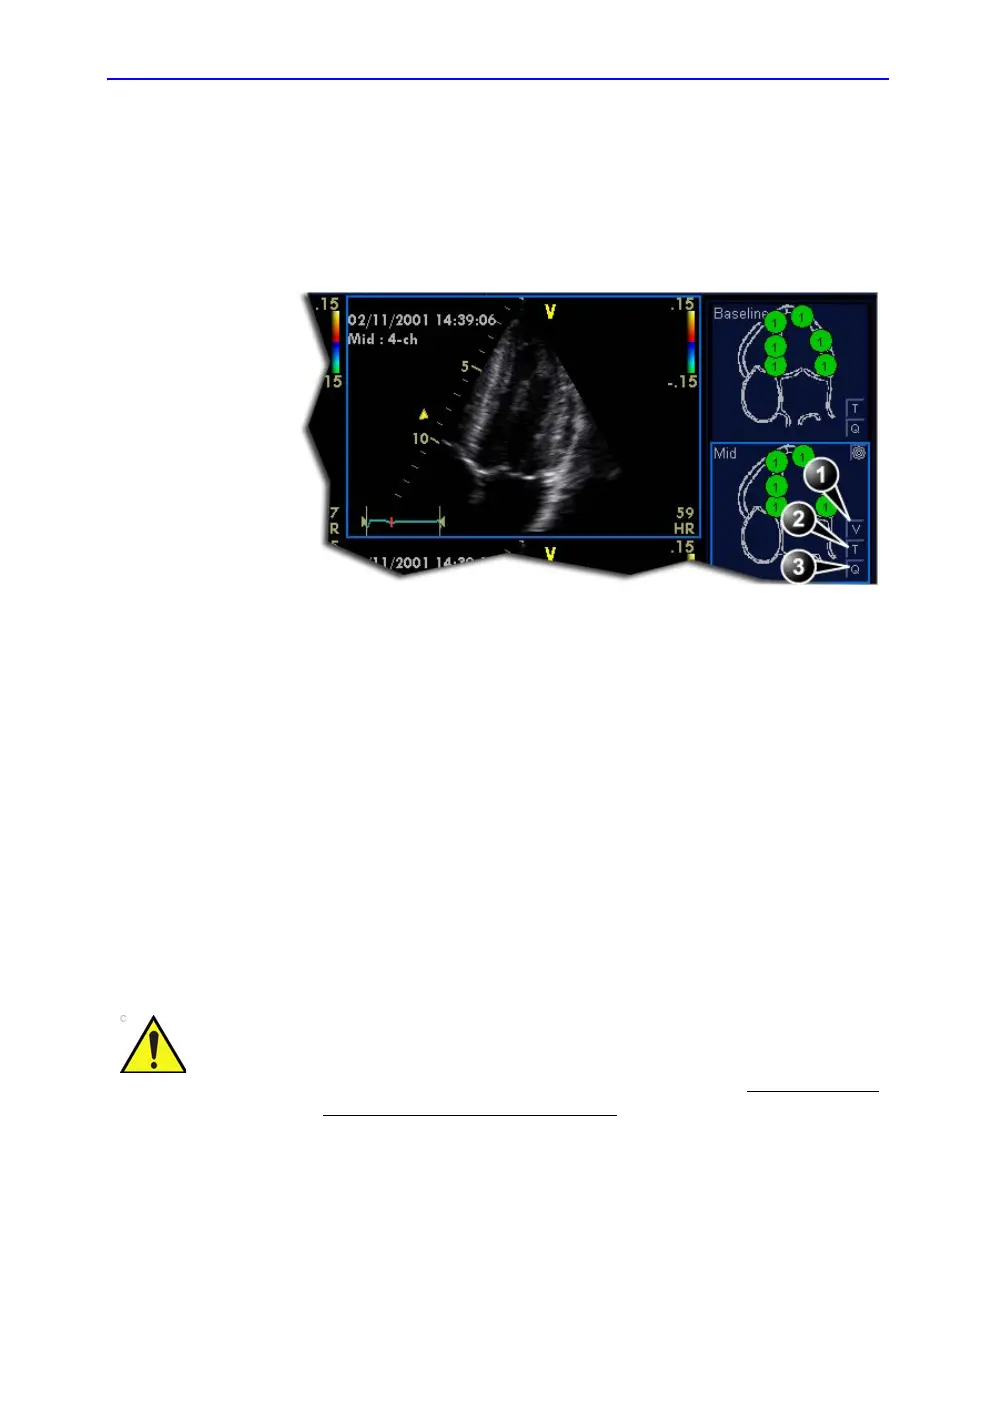
Figure 7-10. QTVI Stress tools buttons
Vpeak measurement
This tool enables the user to generate a tissue velocity profile for
a given wall segment through the entire heart cycle and display
color-coded Vpeak in tissue.
From the velocity trace, the user can determine whether the
systolic Vpeak is over or under a clinically determined velocity
threshold (see reference 1 on page 7-25) to confirm the wall
motion scoring.
1. Vpeak measurement (V-peak measurement is
displayed in views from peak levels and only
after scoring.)
2. Tissue Tracking
3. Quantitative analysis
QTVI Stress can be used only in conjunction with wall motion
scoring analysis, as a guiding tool.
When activating QTVI Stress, the measurement applies only to
the currently highlighted segment for the current level and
projection view.

 Loading...


