4D Auto MVQ
Vivid S70 / S60 – User Manual 8-73
BC092760-1EN 01
Computation is launched and after few seconds the
modified MV model is displayed.
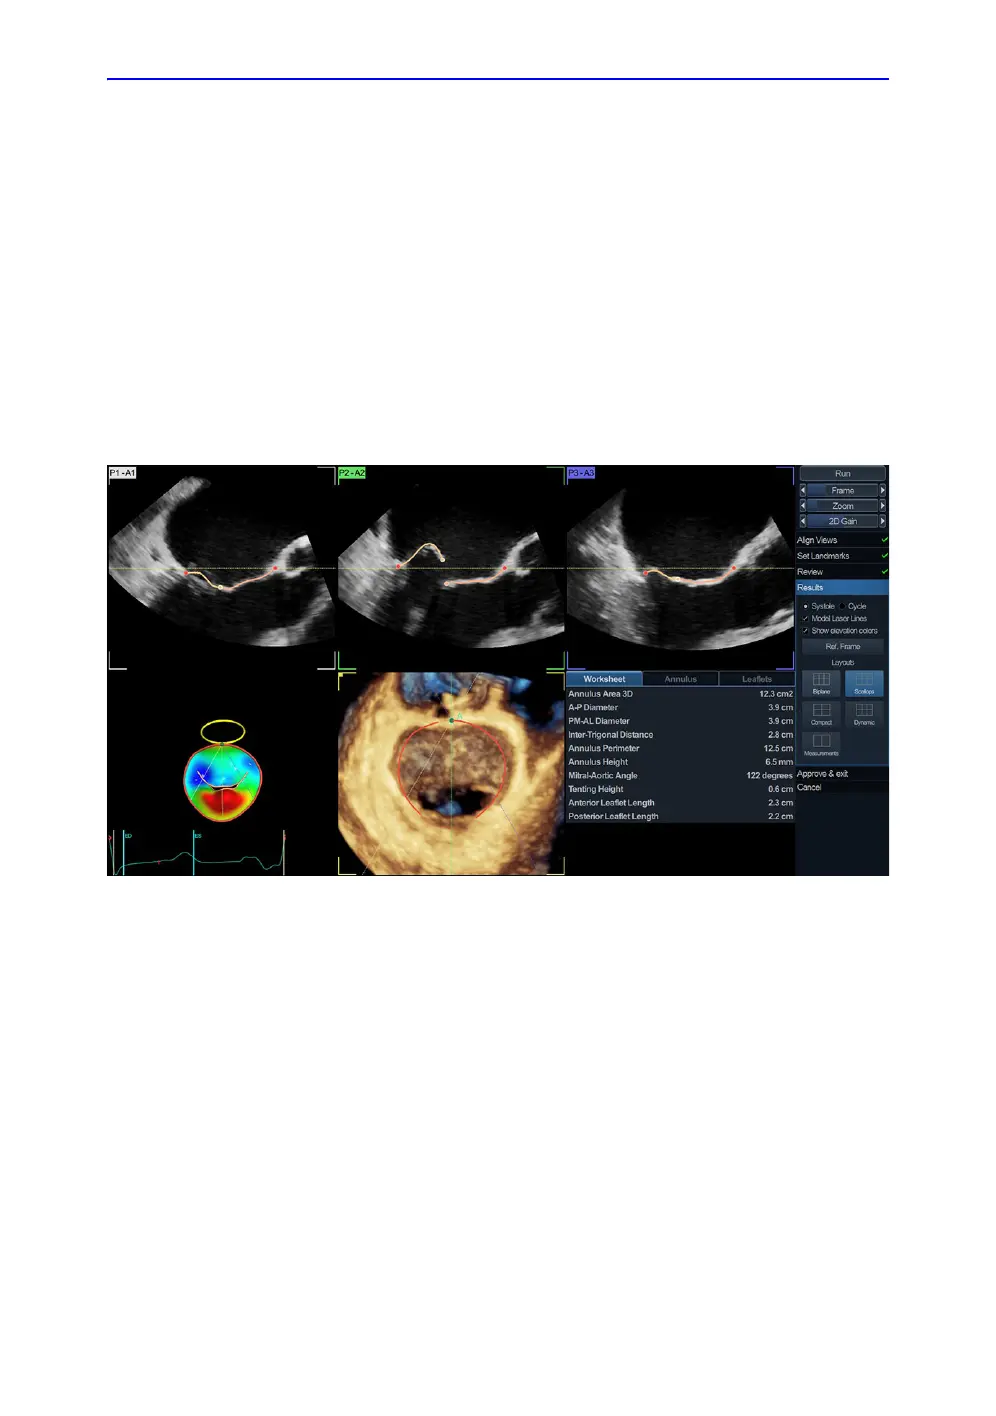
Results
Select the Results stage.
The final segmentation result is shown along with panel
reporting Worksheet, Annulus and Leaflets measurements. By
selecting Dynamic Layout, a graph showing selected
measurement values during systole is shown. By clicking a
measurement the corresponding plot is displayed in Dynamic
Layout, while in other layouts a 3D annotation showing the
measured entity is displayed in the 3D interactive view.
Figure 8-39. The Results screen, showing MV measurements.

 Loading...


