95
8
Verifying the Trends
(Fluctuations) in Measured
Values (TREND Screen)
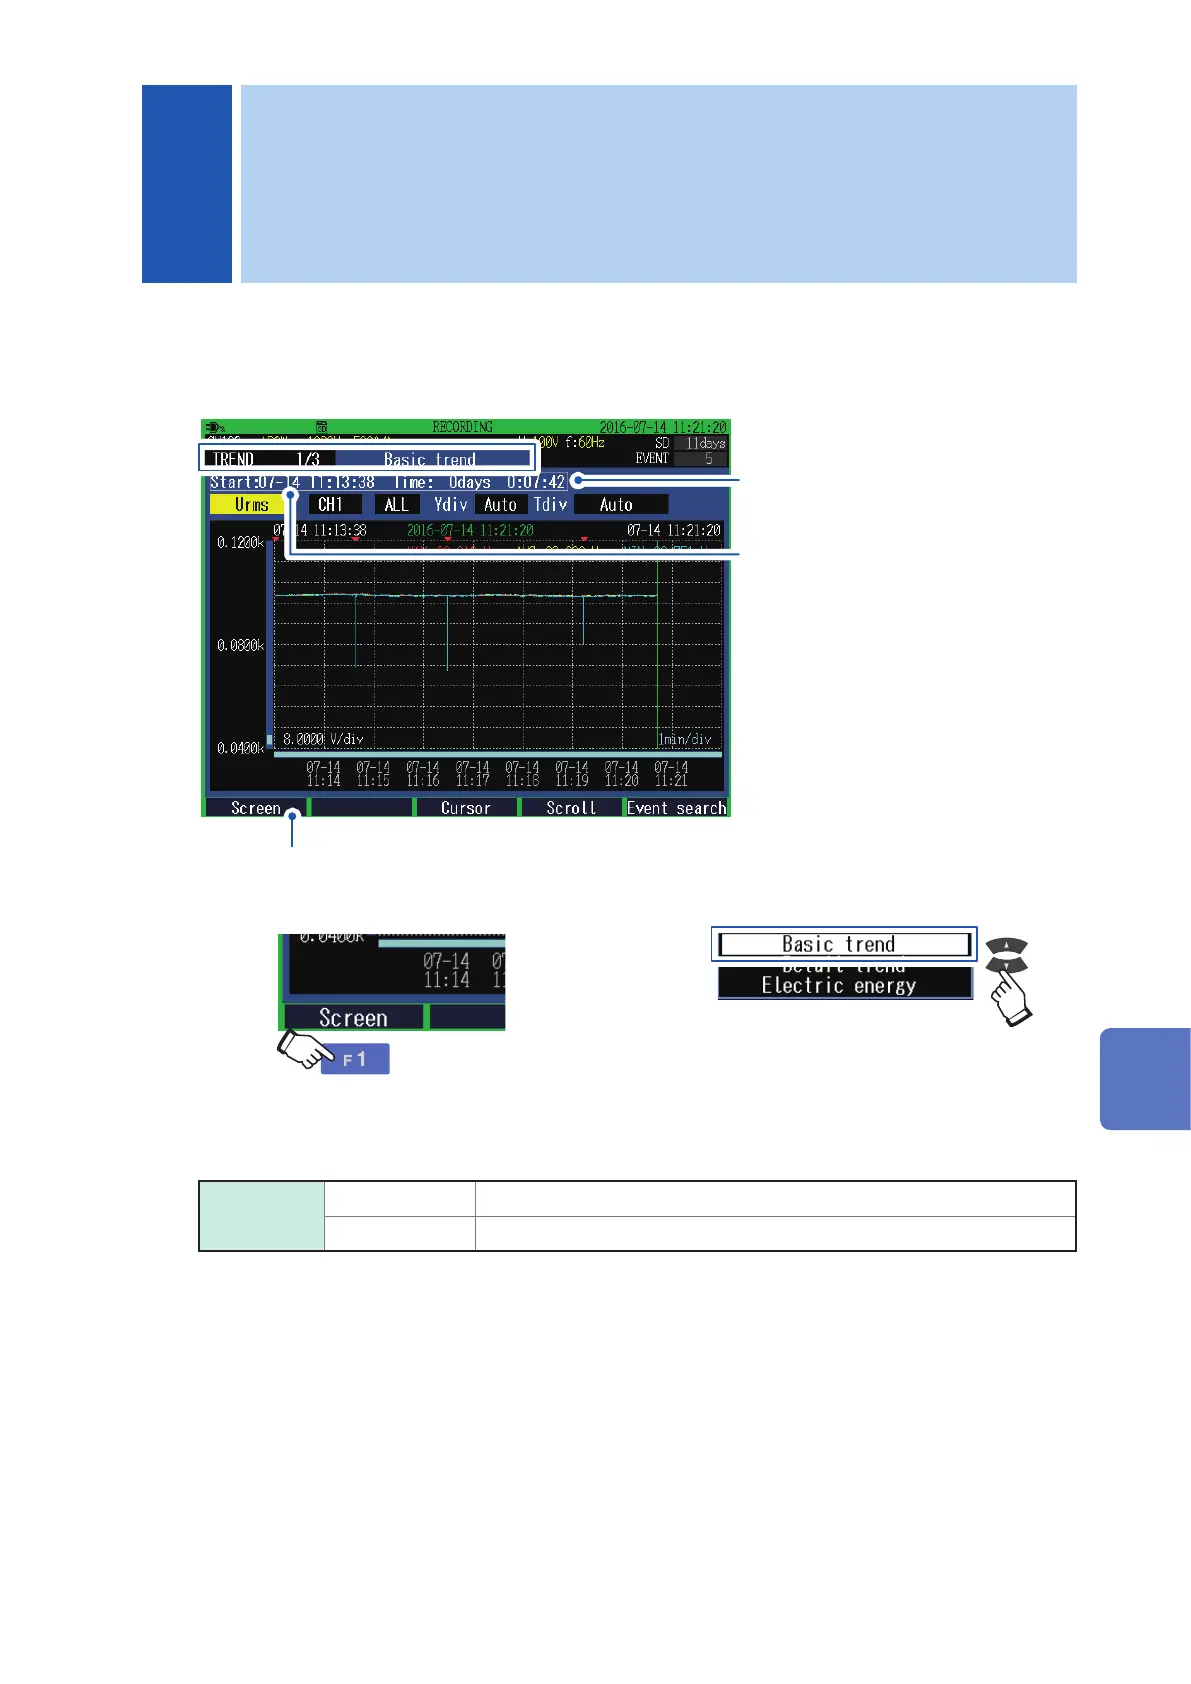
You can view the measured value uctuations as a time series graph on the TREND screen.
Press the [TREND] key to display the TREND screen.
In addition to the [TREND] key, you can also switch to the TREND screen by using the [F1] (screen select)
key.
1
2
Recording start time and date
Elapsed time
The uctuation data that can be displayed on this instrument is limited. If the times listed in the following tables
exceed, the old time series data is rewritten to the new time series data.
Recording
items
Yes harmonic Recording interval × 530
No harmonic Recording interval × 10000
8 Verifying the Trends (Fluctuations) in Measured Values (TREND Screen)
8
Verifying the Trends (Fluctuations) in Measured Values (TREND Screen)

 Loading...