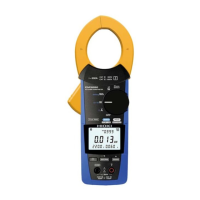
133
Use of Application Software PQ One (Included)
11.2 Use of Application Software PQ One (Included)
What can be done with the application software
The application software PQ One (included) is used for analyzing the data from the instrument
(binary-format) on a computer.
Displays and analyzes measurement data
Event statistics function allows analyzing measured data in detail.
Checking event status daily or hourly allows detecting events with higher frequency at specic a time or on
a specic day of the week.
Easily creates the required graphs
Adjusting the display period of the trend graph when the output is good, and integrating the trend data for 3
phases to a single graph is possible.
Generates measurement data reports
Contents displayed on the screen can be output without any modications. No complicated report settings
are required, and the required reports can be created.
Displays measurement data in EN50160 mode (available after the rmware update)
Converts measurement data to CSV format (available after the rmware update)
Any range of measurement data can be converted to CSV format.
The converted les can be used in spreadsheet programs.
Judges anomalies based on the ITIC (CBEMA) curve* (available after the rmware update)
*: The ITIC Curve is commonly used in America, and is a standard for evaluating voltage anomalies by
specifying a range of acceptable tolerance. A “User-Dened Curve” can be optionally dened for voltage
anomaly evaluation.
Refer to the Application Software Instruction Manual (CD) for details.
11
Analysis (with Computer)

 Loading...