111
Checking Event Status
Switching event monitor screen
When event monitor is displayed, [EVENT] and [MONITOR] keys are lit.
Display/switch screen: [MONITOR] key
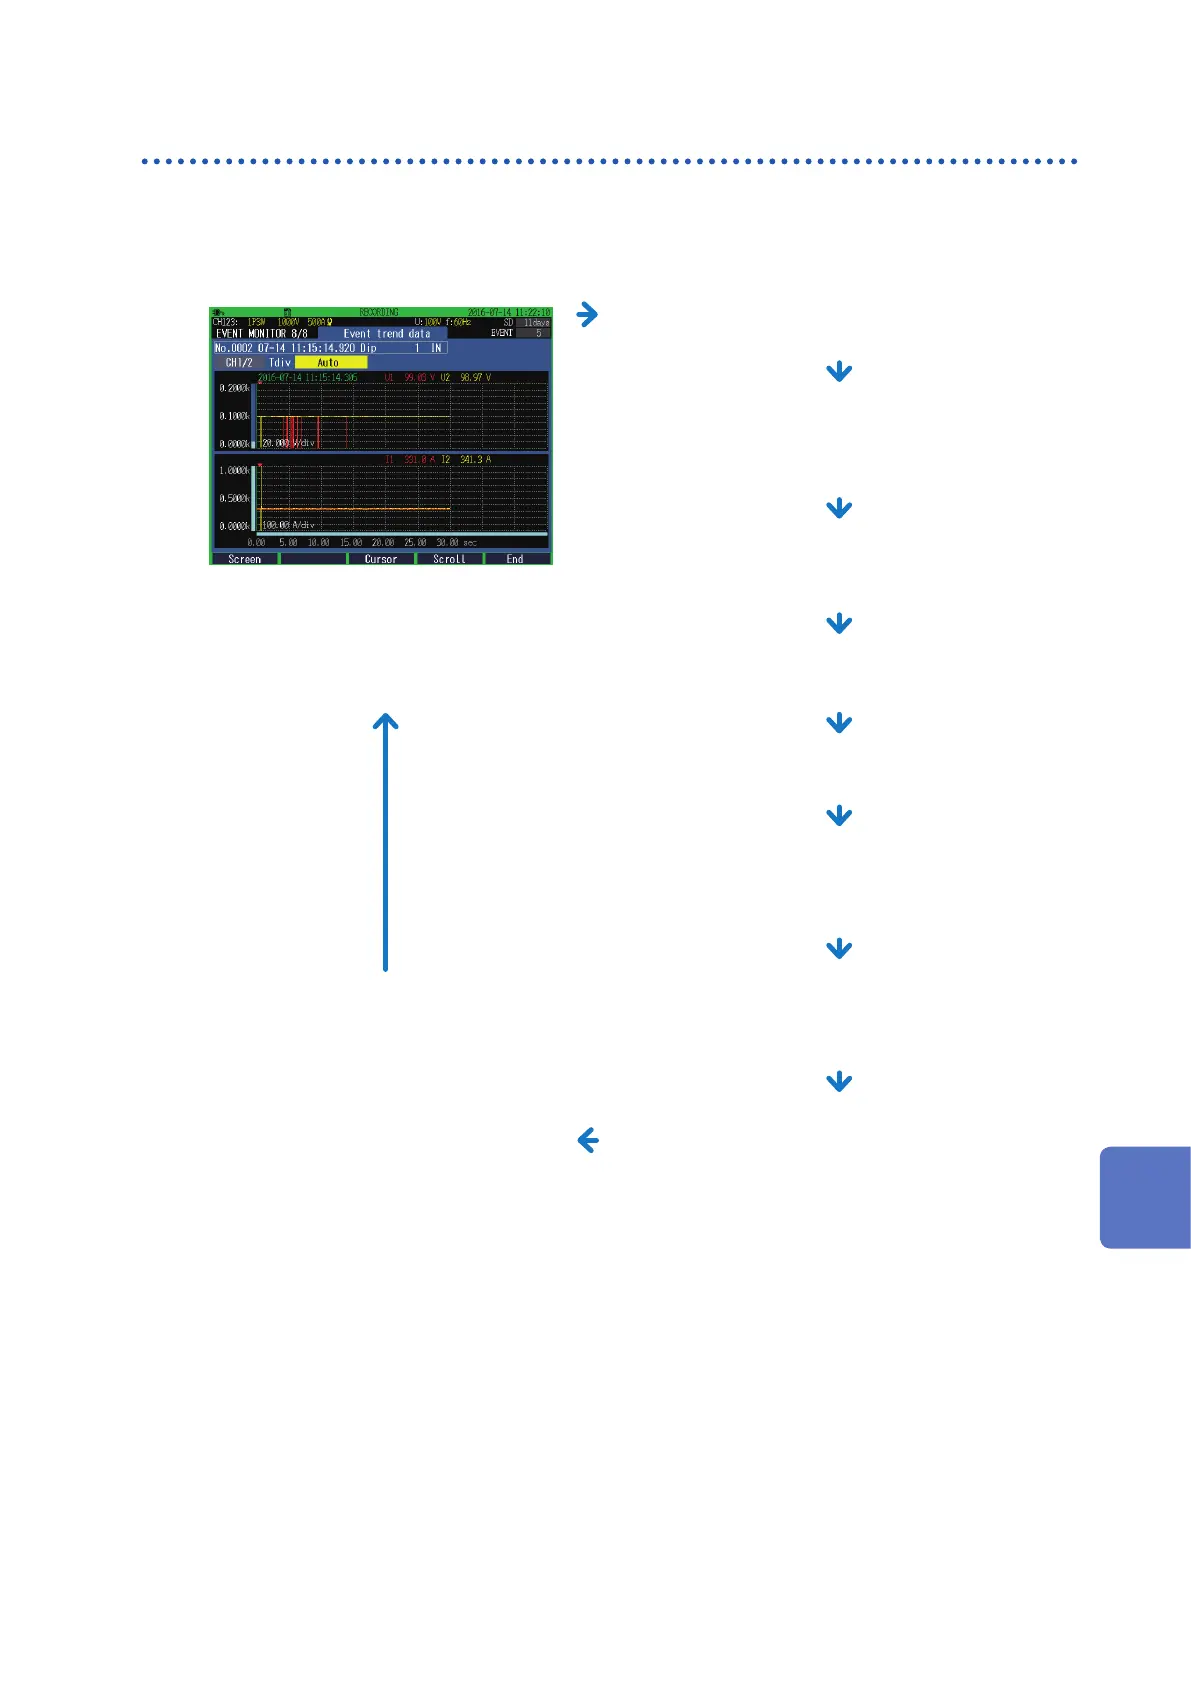
Event trend data screen (p. 112)
Event trend data is shown in a time series
graph.
(This graph appears only for swell, dip,
interruption, and inrush current Event IN.)
Waveform screen (p. 82)*
Voltage and current waveforms of CH1 through CH4 are
displayed.
Electric power screen (p. 84)*
RMS voltage, RMS current, frequency, power, power
factor, active energy (consumption) and elapsed time
are displayed.
Electric energy screen (p. 85)*
Electric energy, energy cost, start time, stop time,
elapsed time, power and power factor are displayed.
Voltage screen (p. 86)*
Measured values related to voltage are displayed.
Current screen (p. 87)*
Measured values related to current are displayed.
Vector screen (p. 88)*
Phase relationship between voltage and current is
displayed in a vector diagram.
Transient waveform screen (p. 113)
(available after the rmware update)
Transient waveforms are also saved.
(Displayed only if a transient overvoltage
event occurred.)
Harmonics screen (p. 89)*
Harmonic voltage, harmonic current, and harmonic
power from 0 to 50th order are displayed.
Zoom screen (p. 91) (available after the
rmware update)*
Enlarged view of 6 user-selected items are available.
*: Data for every 200 ms on an event is displayed.
9
Checking Events (EVENT Screen)

 Loading...