82
Verifying the Voltage Waveform and Current Waveform
6.1 Verifying the Voltage Waveform and Current
Waveform
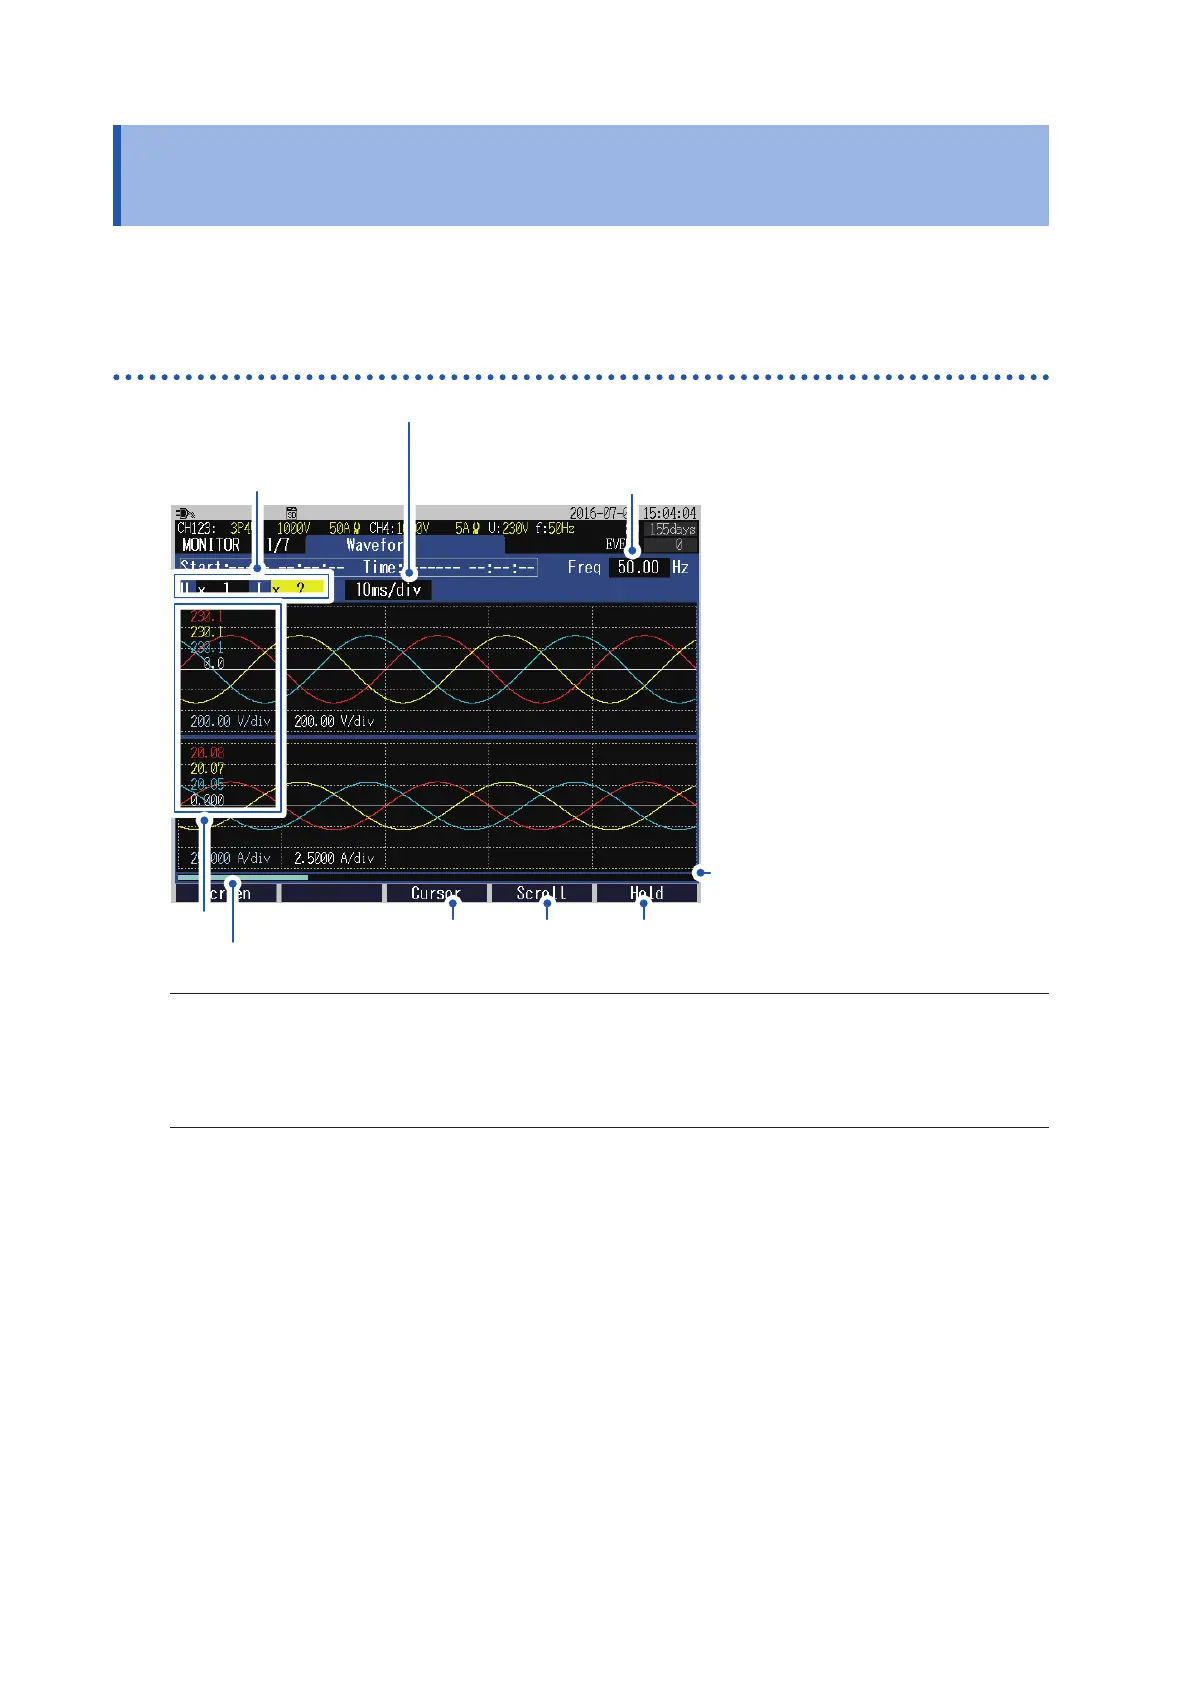
Press the [MONITOR] key to display the MONITOR, Waveform screen.
The voltage waveforms and current waveforms of up to 4 channels are overlapped and displayed.
The color of waveform is same as the phase color.
Screen display
Zoom factor settings
for the vertical axis of
the waveform (p. 83)
Zoom factor settings for the horizontal axis (time axis) of the waveform (p. 83)
Frequency (average value for a period of 200 ms)
1
Screen display scope
p. 83 p. 83 p. 81
Scroll bar
Scope of all measurement data
1
When the cursor is OFF: measured values of each channel (RMS value)
At the time of the cursor measurement: cursor measured values of the waveforms of each channel
(Above diagram shows the screen that is displayed when the cursor is OFF)
See “Verifying the measured value and time at the cursor position (cursor measurement)” (p. 83).

 Loading...