112
Checking Event Status
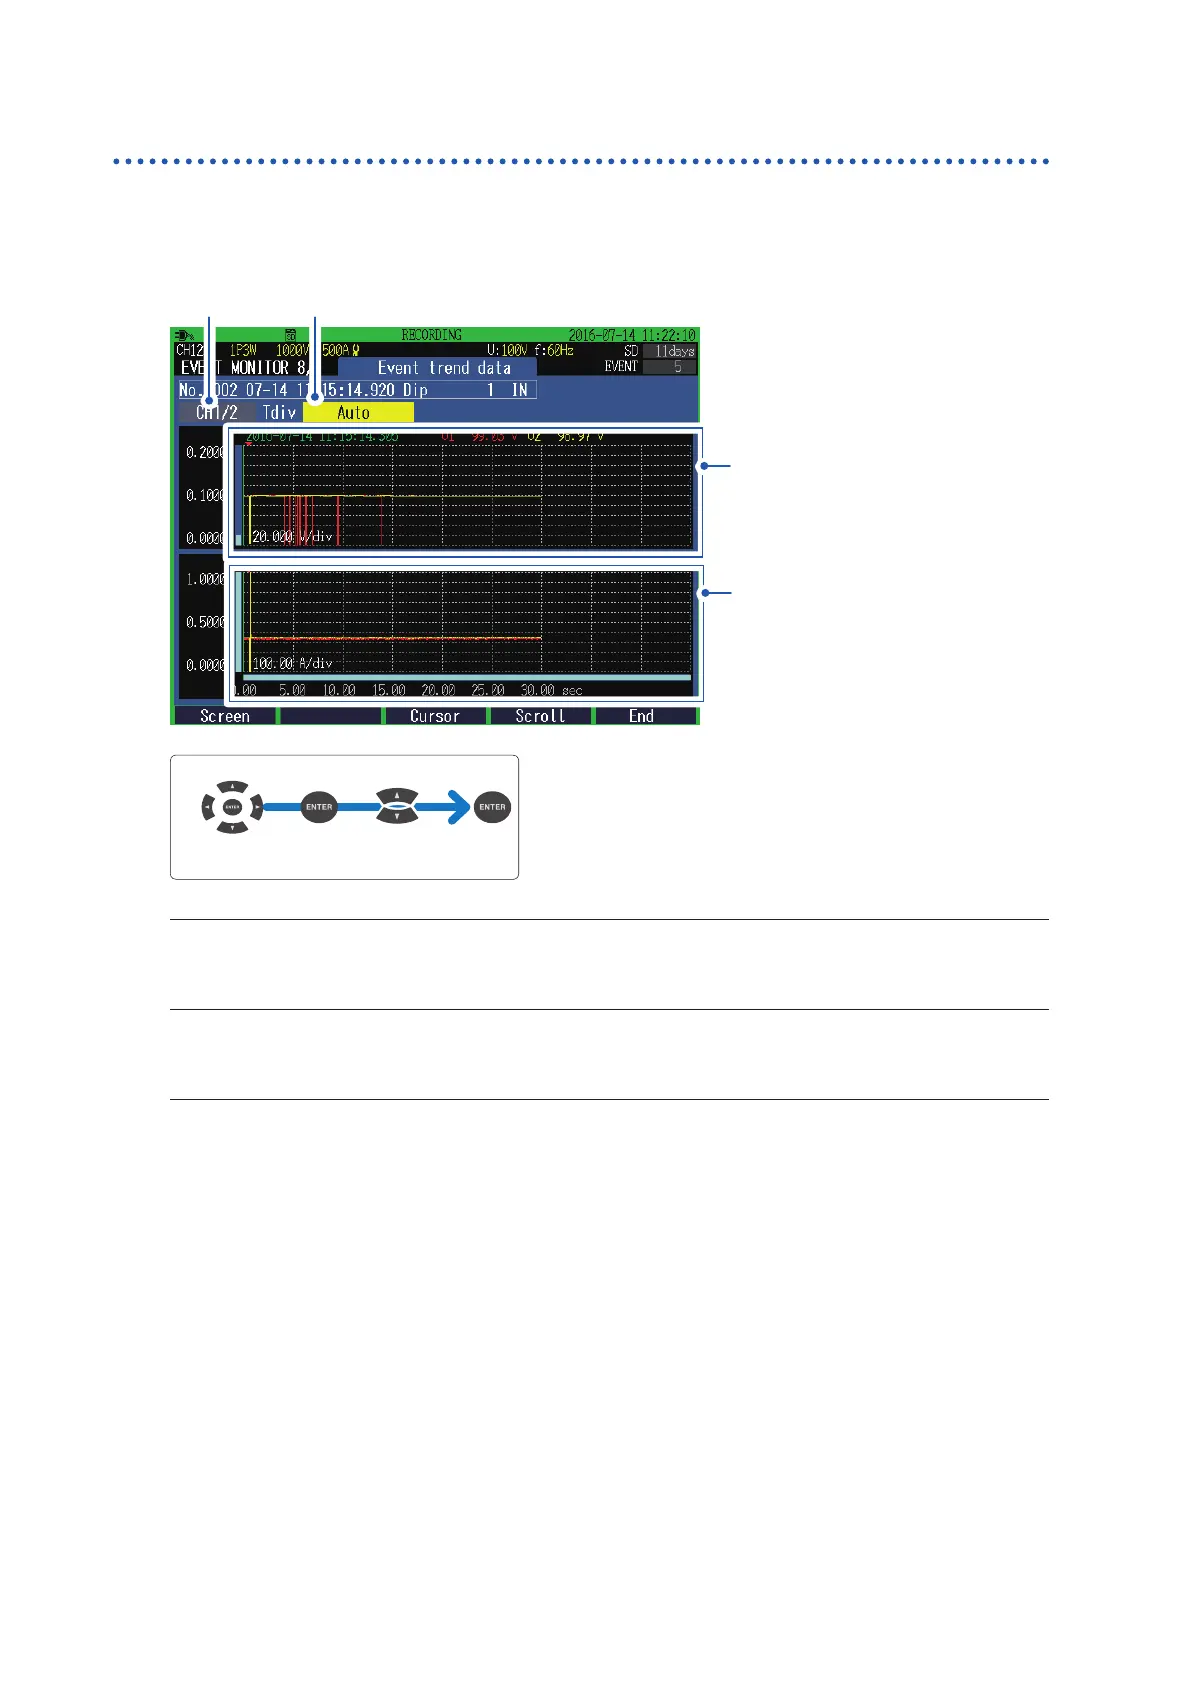
Checking trend data on event
Event trend data of swell, dip, interruption, and inrush current event for 30 s (0.5 s before Event IN,
29.5 s after Event IN) is displayed in a time series graph.
How to display the EVENT MONITOR screen: p. 110
Voltage trend data on a swell, dip, or
interruption event (Urms1/2)
• Current trend data on a swell, dip, or
interruption event (Irms1/2)
or
• Current trend data on an inrush
current event (Inrush)
1 2
Move the cursor
Select
1
Enables you to set the display channel.
CH1/2/3 (depending on the wiring settings), CH4 (when the wiring settings are enabled)
2
Set a horizontal axis zoom factor for the graph.
Auto, 0.10sec/div, 0.25sec/div, 0.50sec/div, 1.00sec/div, 2.50sec/div, 5.00sec/div
• The event trend data appears only for swell, dip, interruption, and inrush current Event IN.
• Even if another event occurred during event trend data recording (30 s), the event trend data for the event
will not be saved.

 Loading...