101
Verifying the Electric Energy
8.3 Verifying the Electric Energy
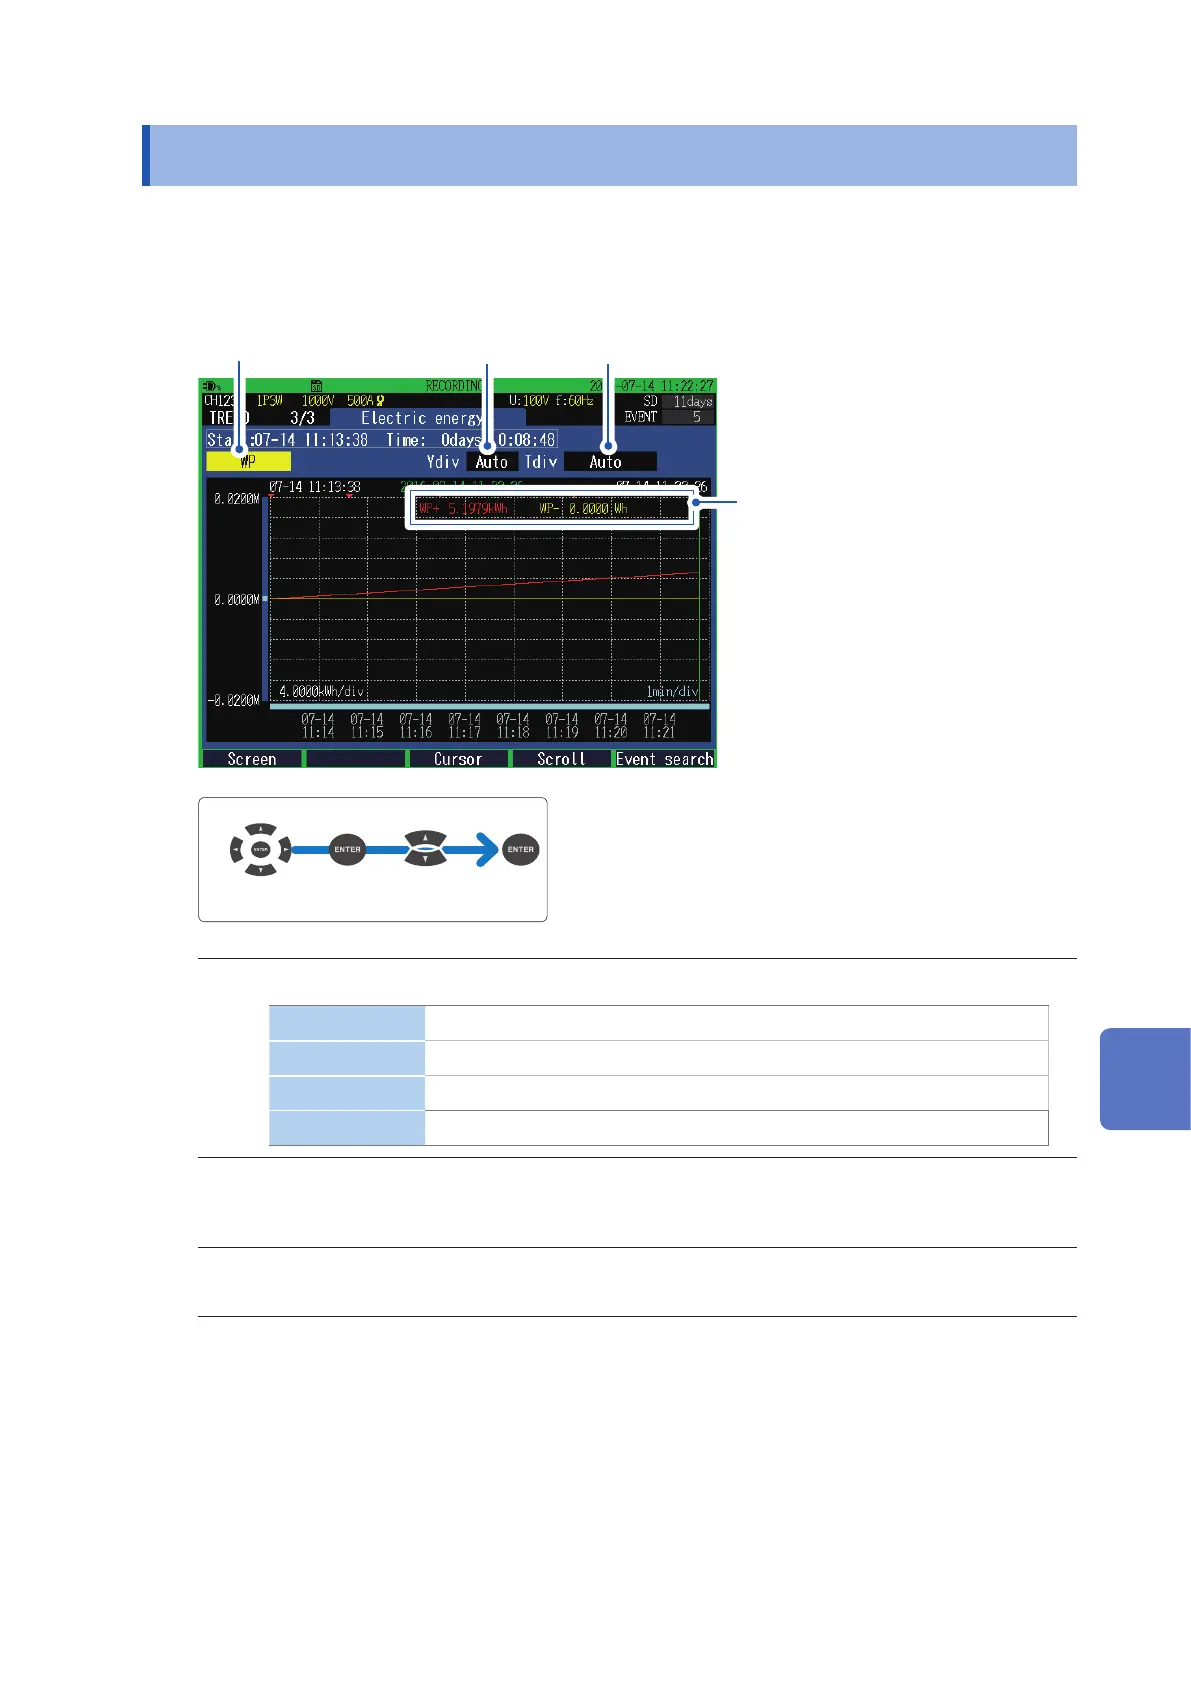
Press the [TREND] key to display the TREND, Electric energy screen.
This screen is used to check electric energy trends for each recording interval.
Since all the items are updated after every 1 s, the data is updated after every 1 s, when the
recording interval is below 1 s.
1 3
The latest measured values are displayed
when the cursor is disabled, while the
measured values at the position of
cursor are displayed during the cursor
measurement.
(The gure on the left illustrates the
screen that is displayed when the cursor
is disabled.)
2
Move the cursor
Select
1
Enables you to set the display parameters.
WP Active electric energy (WP+: consumption, WP-: regeneration)
WQ Reactive electric energy
WS Apparent electric energy
Ecost Energy Cost
2
Set the zoom factor for the vertical axis of the graph.
Auto, ×1, ×2, ×5, ×10, ×25, ×50
3
Set the zoom factor for the horizontal axis (time axis) of the graph.
The horizontal axis (time axis) which can be set, differs according to the recording intervals.
8
Verifying the Trends (Fluctuations) in Measured Values (TREND Screen)

 Loading...