Appx.18
Detailed Explanation of IEC Flicker and ∆V10 Flicker (available after the rmware update)
Appx. 6 Detailed Explanation of IEC Flicker and
∆
V10 Flicker (available after the rmware
update)
IEC icker meter
The IEC icker function is based on the international standard IEC61000-4-15, “Flickermeter -
Functional and design specications.”
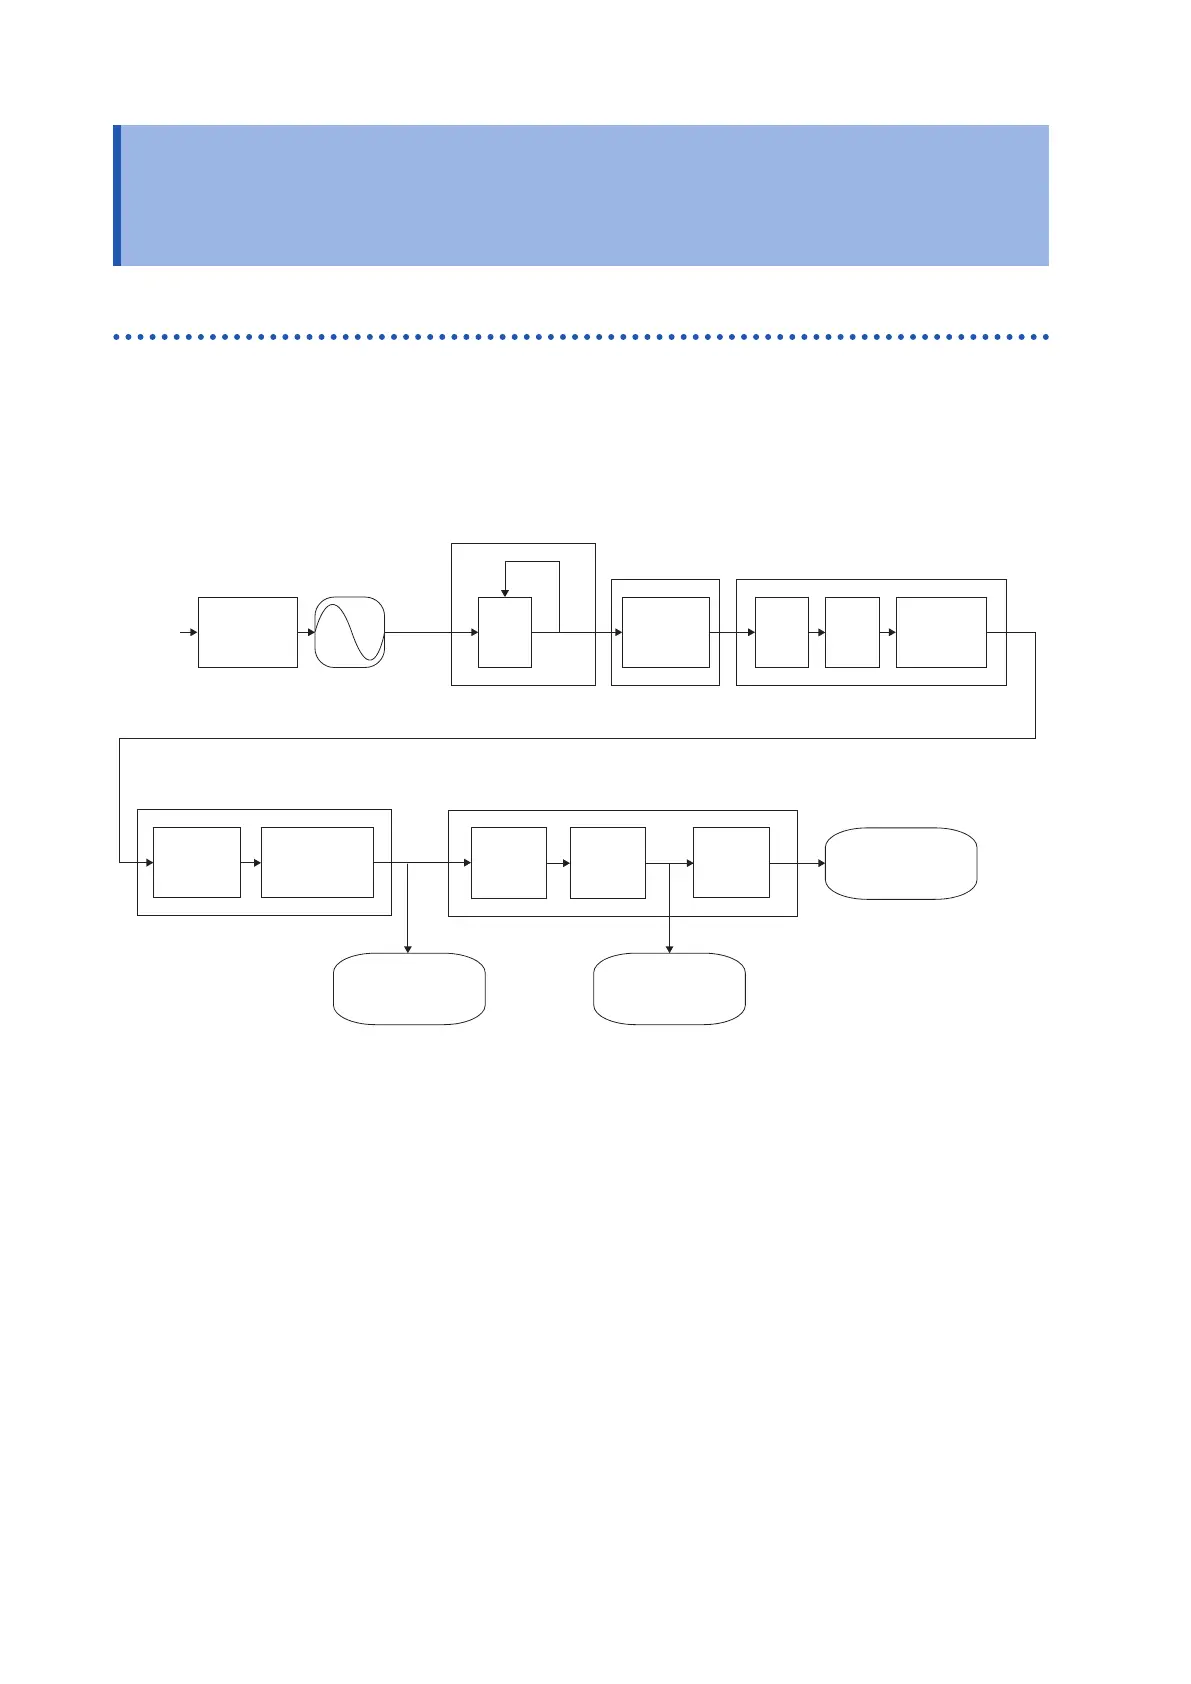
IEC icker meter function diagram
Block 3
Weighted Filter
Block 2
Square Multiplier
Block 1
Input Voltage Adapter
Block 4
Square Smoothing
Block 5
Online Statistics Analysis
Waveform Data
Voltage
Waveform
A/D
Conversion
AGC LPF HPF
Classifica-
tion
Pst
Calculation
Plt
Calculation
Luminosity
Filter
Square
Square
Primary
Smoothing and
Averaging Filter
Instantaneous Flicker
Value
S(t)
Short-term Flicker
Pst
Long-term Flicker
Plt
Pinst
Weighting lter
You can select a weighted lter for either a 230 V lamp system or a 120 V lamp system.
Statistical processing
Statistics on icker are compiled by applying the cumulative probability function (CPF) to 1,024
divisions of instantaneous icker values Pinst in the range from 0.0001 P.U.* to 10000 P.U. on the
logarithmic axis to obtain cumulative probabilities P0.1, P1s, P3s, P10s, and P50s.
*: The unit [P.U.] stands for perceptibility unit. Various lters are designed in order that the maximum
value of Pinst corresponds to 1 [P.U.] when a voltage uctuation that human beings recognize as a
icker is input to them.

 Loading...