71
Measuring Harmonic
3.4 Measuring Harmonic
The instrument includes harmonic measurement functions as a standard feature and can acquire
measured harmonic values synchronous with measured power values for all channels. These
measured harmonic values are used to calculate the fundamental wave component (fnd value) and
total harmonic distortion (THD), which are included in the instrument’s basic measurement items.
See “10.5 Specications of Equations” (p. 212).
Displaying measured harmonic values
Harmonics can be displayed using a bar graph, list, or vectors.
Displaying a harmonics bar graph
Harmonic analysis is performed on the voltage, current, and active power values for the same
channel, and the results are displayed as bar graphs.
Numerical data of the on-screen order is also displayed at the same time.
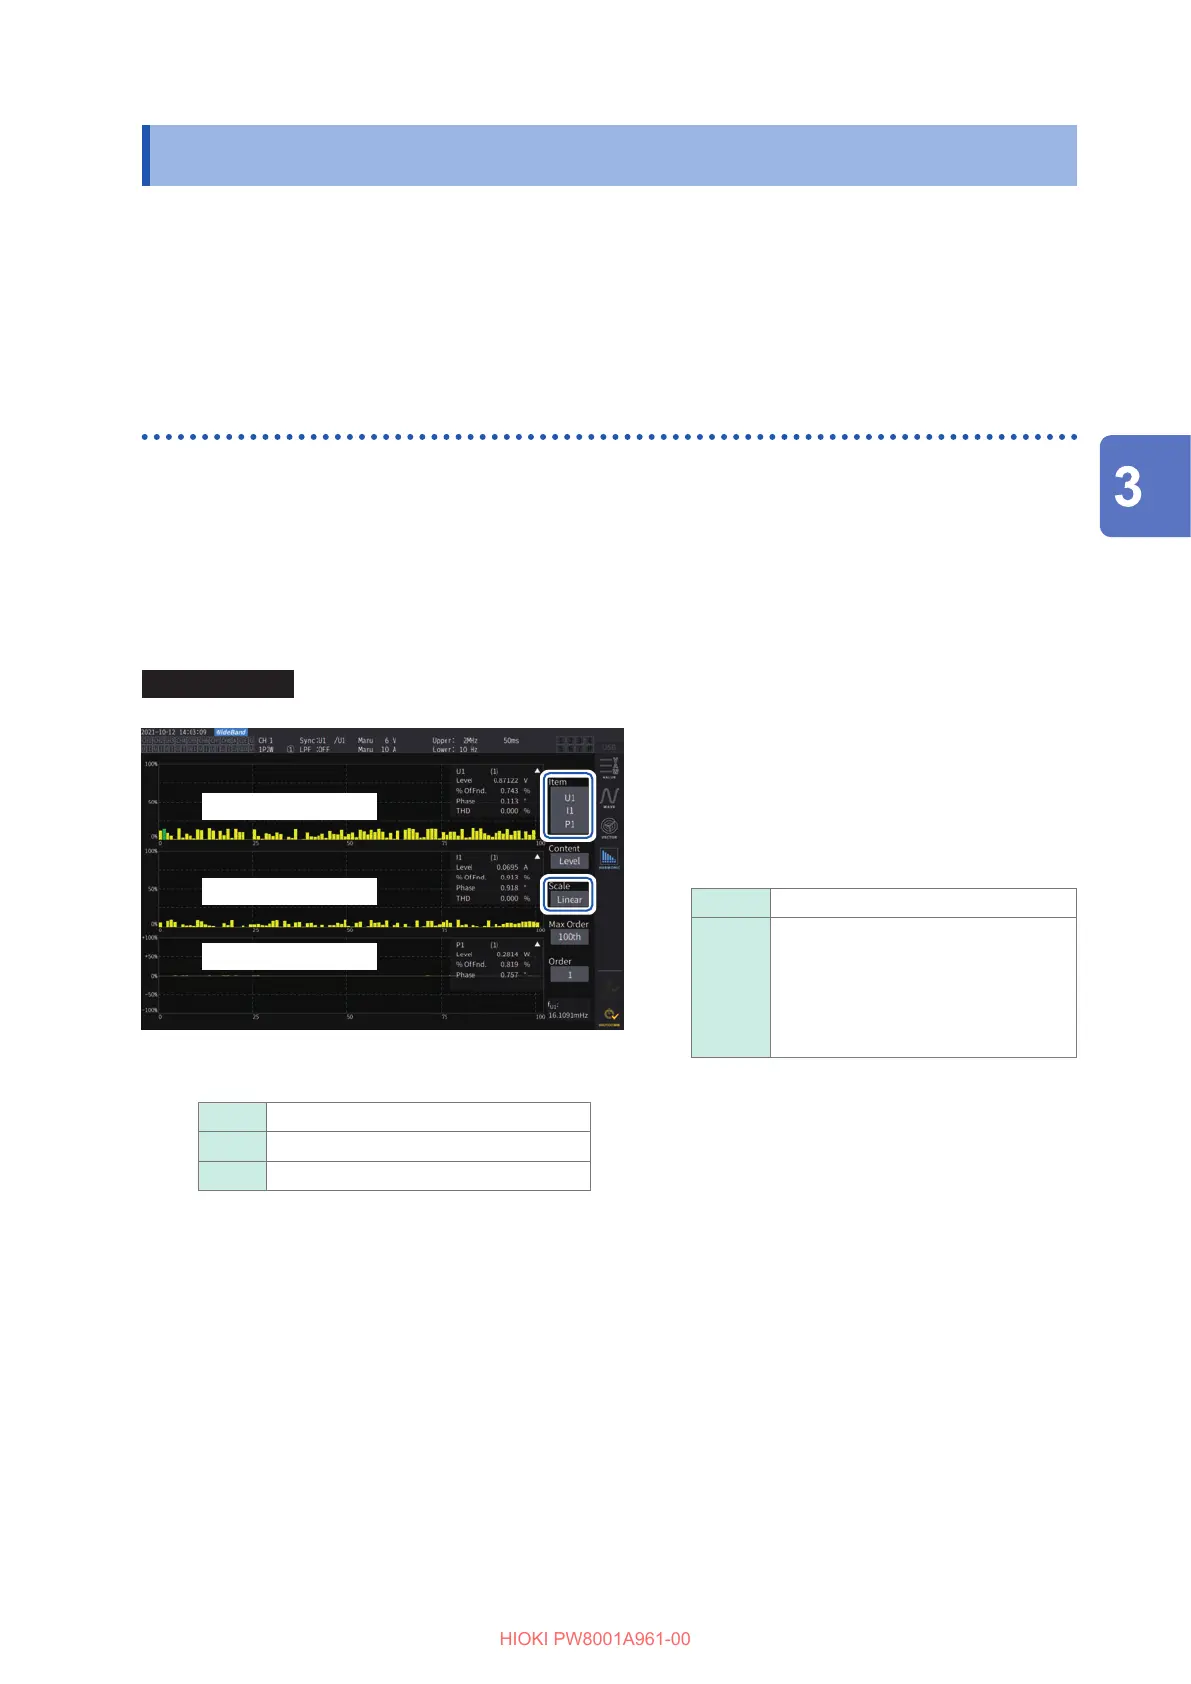
Display screen [MEAS] > [HARMONIC] > [BAR GRAPH]
11
Harmonic voltage
Harmonic current
Harmonic active power
22
1
Tap the [Item] box, then select channels
to be displayed on the bar graph.
2
Tap the [Scale] box, then select a scale
of the vertical axis from the list.
Log Logarithmic scale
Linear
Linear scale
This can display data down to
minuscule levels.
When [Phase] is selected, the
vertical axis display is xed to
[Linear].
On-screen measured values of the selected orders
W Amplitude value (Level)
% Content percentage (% of Fnd)
°
Phase angle (phase)
• The vertical axis scale is a percentage of the range when the amplitude value is selected.
• When the phase angle is selected, dimmed bars may be displayed to indicate that the
corresponding amplitude value is small (0.01% or less of the range).
Displaying Power Numerically

 Loading...


