13 Configuration – in setup program only
162
The value range for the linearization (linearized values, y axis) is monitored in the module and
limited as follows:
Lower limit of the value range = Ymin - 0.0125 × (Ymax - Ymin)
Upper limit of the value range = Ymax + 0.03125 × (Ymax - Ymin)
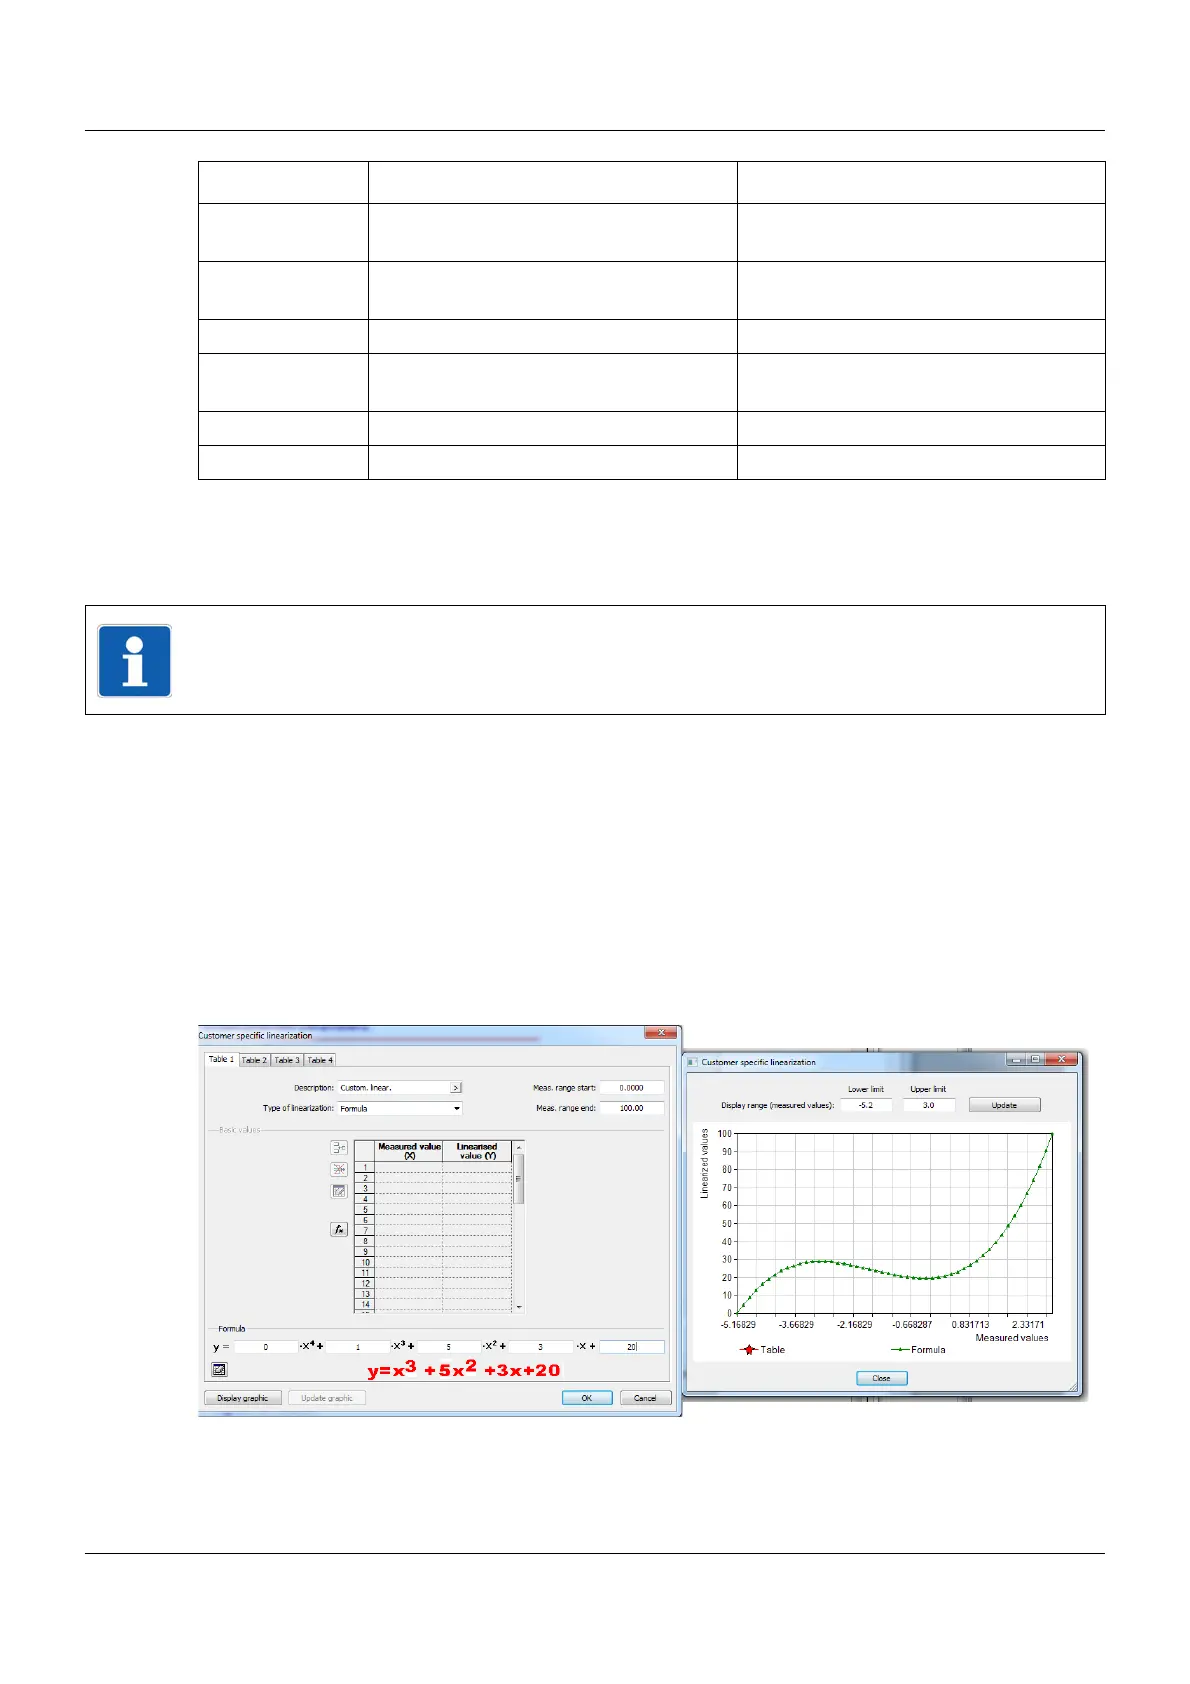
Displaying linearization on a graphic ("Display graphic" button)
Use this button to create a graphic of the linearization.
The graphic includes the characteristic lines for both types of linearization where applicable,
namely the formula and the grid points (table).
The display range for the graphic is first of all determined by the "measuring range start" and
"measuring range end" values (y values); it can be temporarily changed in the display by en-
tering different x values
Example of 3rd-order polynomial
.
Meas. range end
(Ymax)
-99999 to 100 to +99999 End value of the y axis
X0 -99999 to 0 to +99999 Absolute component of the polynomial
(point of intersection with the y axis)
X1 -99999 to 1 to +99999 Coefficient of the linear component (x)
X2 -99999 to 0 to +99999 Coefficient of the quadratic
component (x
2
)
X3 -99999 to 0 to +99999 Coefficient of the cubic component (x
3
)
X4 -99999 to 0 to +99999 Coefficient of the quartic component (x
4
)
Parameter Selection/settings Description
NOTE!
A linearized value that lies outside of the value range results in a deviation above or below
the measuring range (out of range).