161
13 Configuration – in setup program only
Displaying linearization on a graphic ("Display graphic" button)
Use this button to create a graphic of the linearization.
The graphic includes the characteristic lines for both types of linearization where applicable,
namely the grid points (table) and the formula.
The display range for the graphic is initially determined by the smallest and largest grid points;
it can be temporarily changed in the display by entering different x values.
Calculating the polynomial using the grid points ("fx" button)
After entering the value pairs, use this button to calculate a polynomial that describes the pro-
gression of the linearization characteristic line.
The calculated coefficients are incorporated into the formula. The characteristic lines for both
types of linearization then correspond to each other.
If the x values do not increase in a straight line, the linearization is not applied. In this case, it
is impossible to display the graphic or calculate the polynomial.
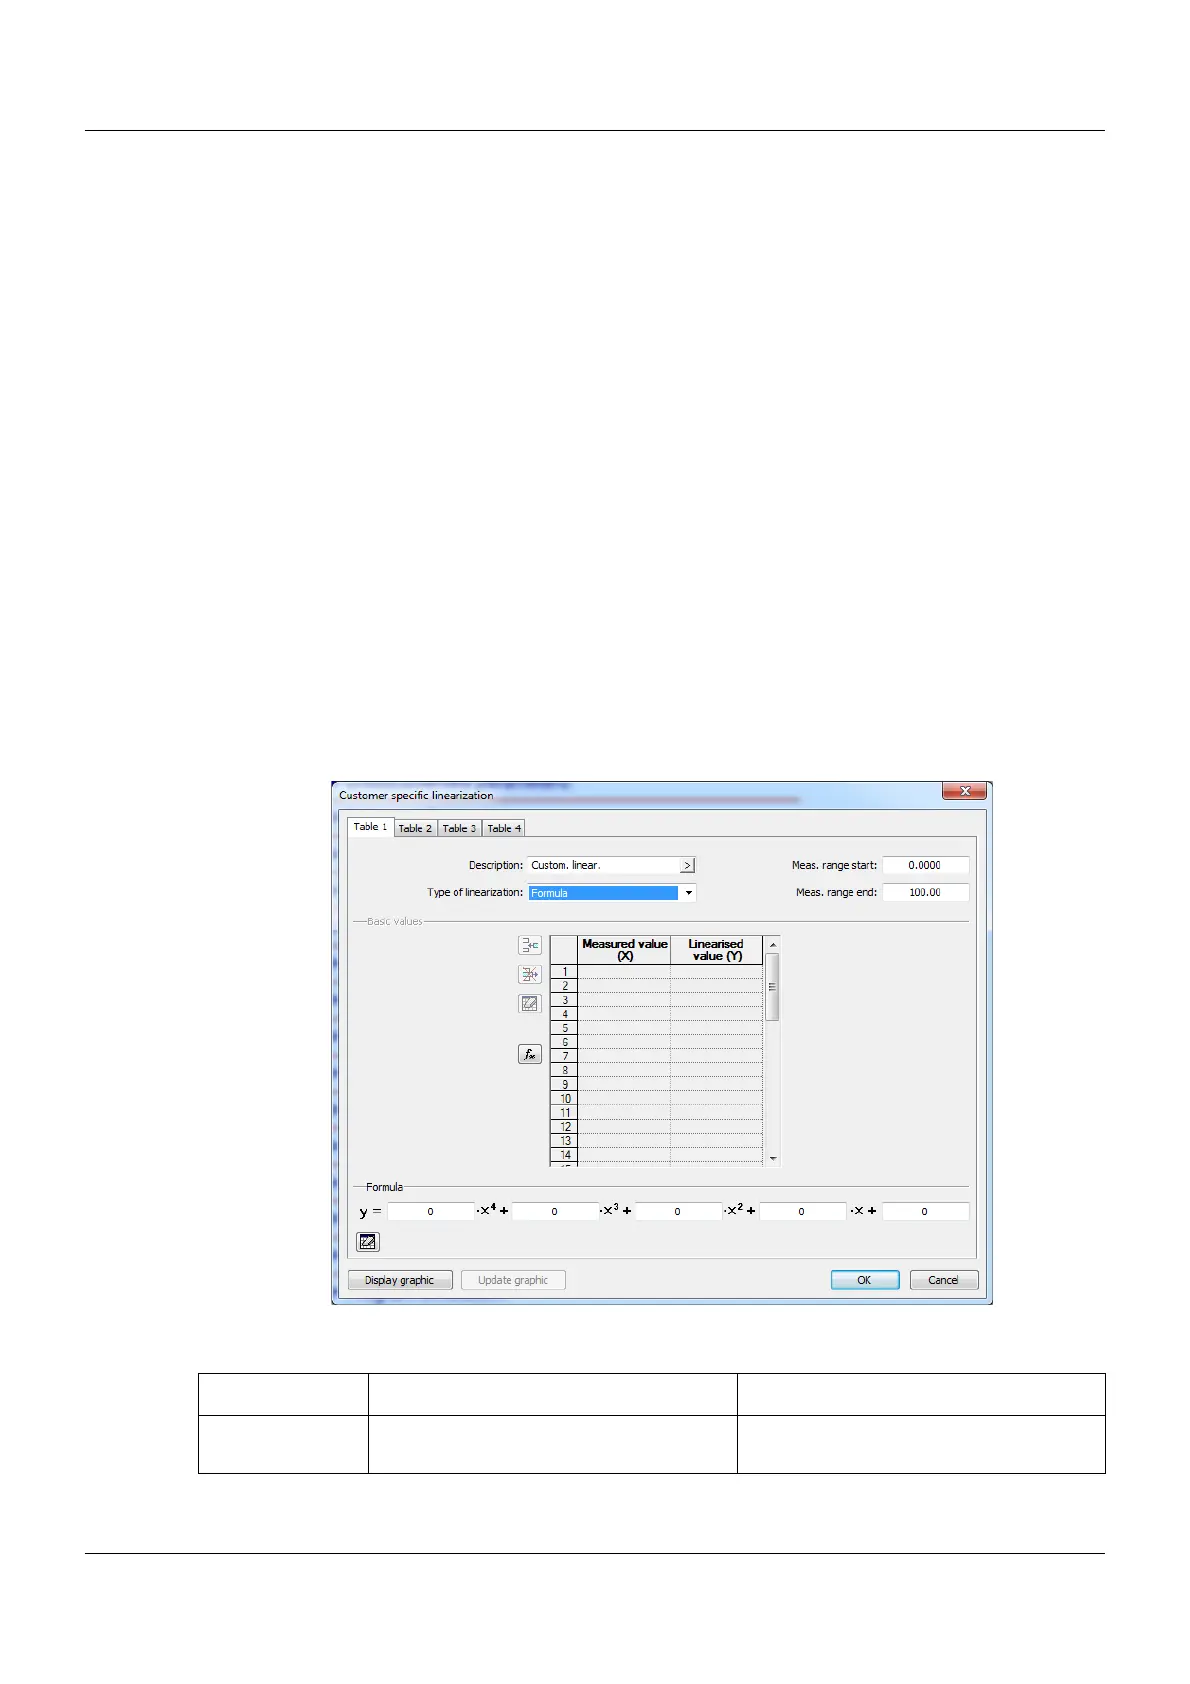
13.12.2 Formula
Customer-specific linearization is specified using a 4th order polynomial. The polynomial is cal-
culated for the entire linearization range.
Polynomial formula: y = X4*x
4
+ X3*x
3
+ X2*x
2
+ X1*x + X0
Setup dialog box
Parameters
Parameter Selection/settings Description
Meas. range start
(Ymin)
-99999 to 0 to +99999 Start value of the y axis