ASAP 2460 Operator’s Manual Report Options Files
246-42800-01 - Aug 2013 3-35
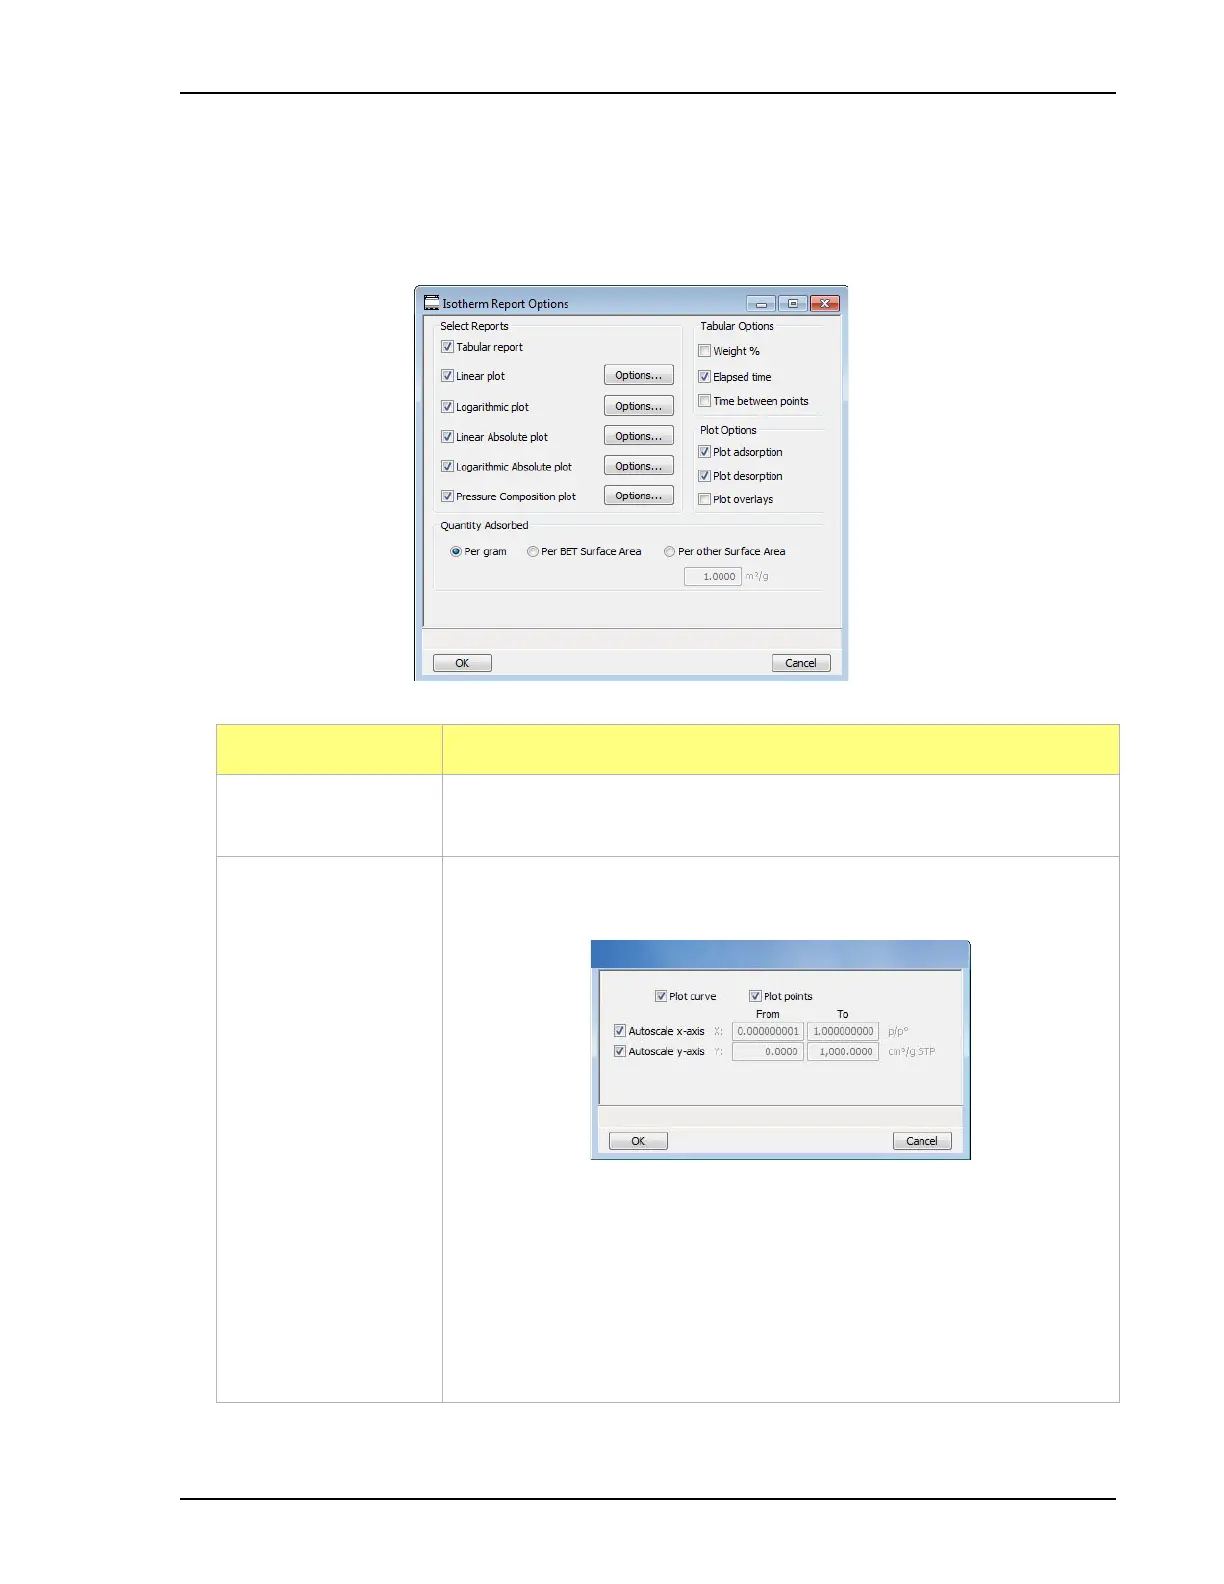
Isotherm Report Options
The Isotherm report indicates adsorption (up to saturation pressure) and desorption (down from satu-
ration pressure) of a gas by a solid held at constant temperature. In the Selected Reports list box,
highlight Isotherm, then click Edit.
Field or Button Description
Select Reports
group box
Select the checkbox to the left of each option to include on the final report.
Options buttons Click to display related linear plot options. All plot windows contain
identical fields.
• Plot curve / Plot points - use to plot curves and/or points.
• Autoscale x-axis - linear x-axes begin at zero. Logarithmic x-axes
begin at an appropriate value. The x-axis field shows the relative or
absolute pressure.
• Autoscale y-axis - the y-axis field shows the quantity of gas adsorbed.
 Loading...


