2460 Operator’s Manual Regression Report
246-42800-01 - Aug 2013 5-7
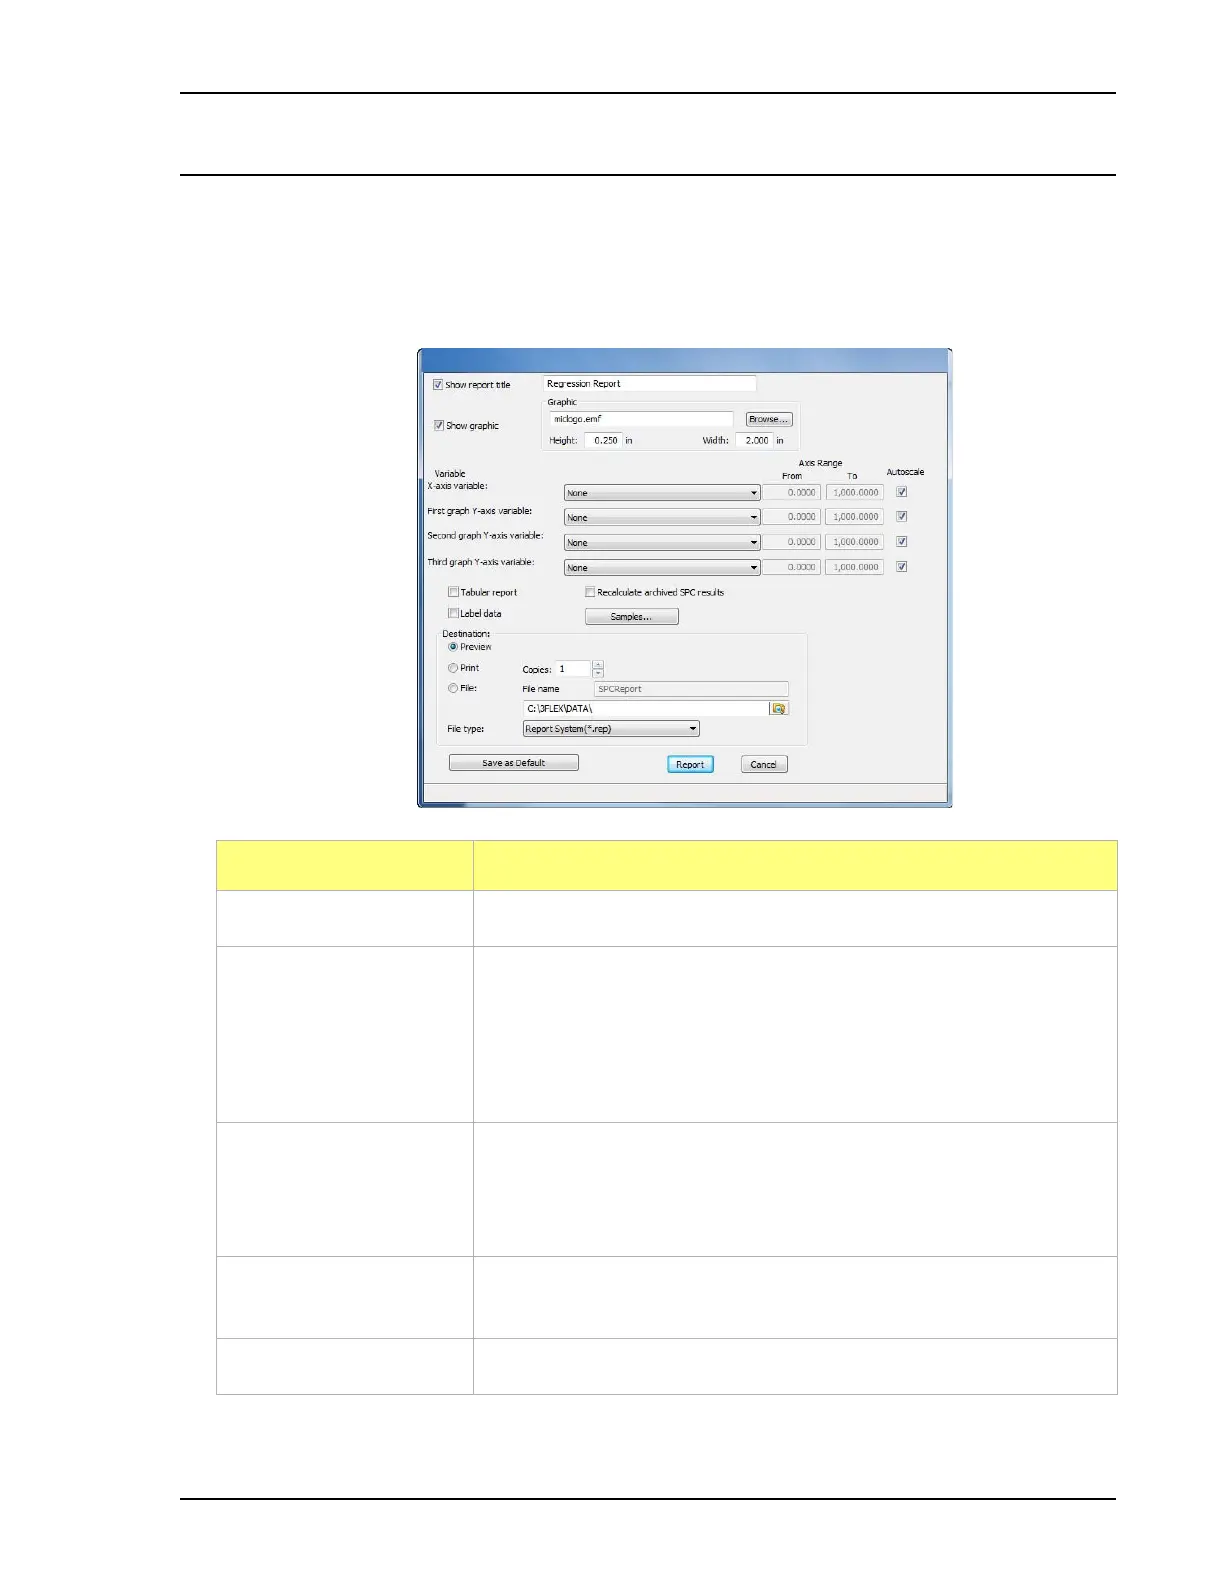
Regression Report
Reports > Regression Report
Use to generate an SPC (Statistical Process Control) Regression report to determine the interdepen-
dency between two variables. Up to three dependent variables (y-axis) may be plotted against a single
independent variable (x-axis). The degree of correlation between the variables is also reported.
Field or Button Description
Show report title text box Select and enter a report title to appear on the report header.
Show graphic
text box
Use to show a graphic on the report header. Click the Browse button to
locate the graphic.
• Height / Width - enter the height and width of the selected graphic.
These values determine the graphic appearance on the generated
report.
X- and Y-Axis
Variable
dropdown lists
Use to designate the x- and y-axes variables. The variables in the
dropdown lists are those selected in the Reports > SPC Report Options
window. Use these options to plot the regression of up to three y-axis
variables against the x-axis variable.
Axis Range
text boxes
Enter the beginning and ending values for the x- and y-axis ranges.
These fields are disabled if Autoscale is selected.
Autoscale checkboxes When enabled, allows the x- and y-axes to be scaled automatically.
 Loading...


