ASAP 2460 Operator’s Manual Report Options Files
246-42800-01 - Aug 2013 3-43
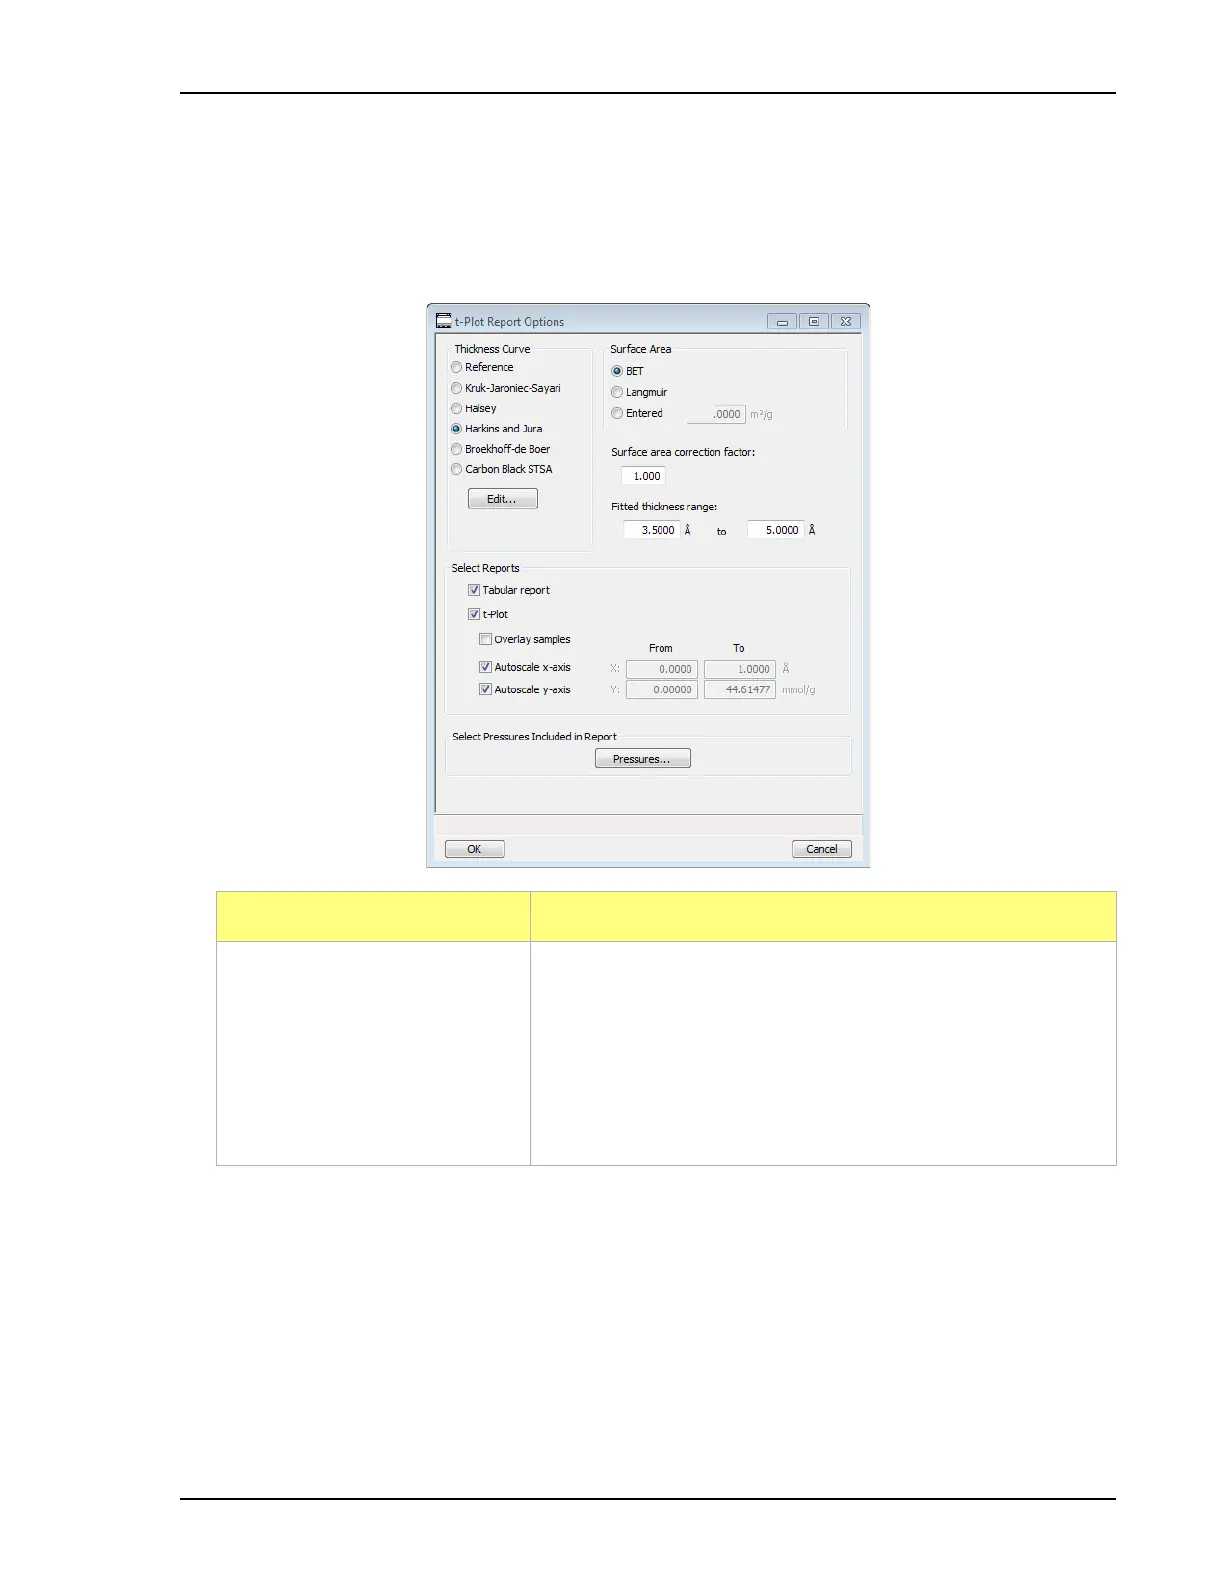
t-Plot Report Options
The t-Plot calculation allows quantitative analysis of the area and total volume ascribed to micropores.
Matrix area (the area external to micropores) is directly determined and often proves to be a valuable
way of characterizing complex mixed materials. In the Selected Reports list box, highlight t-Plot,
then click Edit.
Field or Button Description
Thickness Curve group box Select the thickness curve and click Edit to modify the values in
the equation for the selected curve. The Frenkel-Halsey-Hill
thickness curve can be applied using the Halsey option.
Reference option - select Reference and click Edit to define a
t-curve by entering the relative pressure and thickness values.
One predefined curve is shipped with the analysis program and
is found in the Reference directory.
 Loading...


