ASAP 2460 Operator’s Manual Report Options Files
246-42800-01 - Aug 2013 3-69
Plot Options
In the MP-Method Report Options window, highlight a plot option in the Selected Reports list box
and click Edit to customize the plotting method.
Field or Button Description
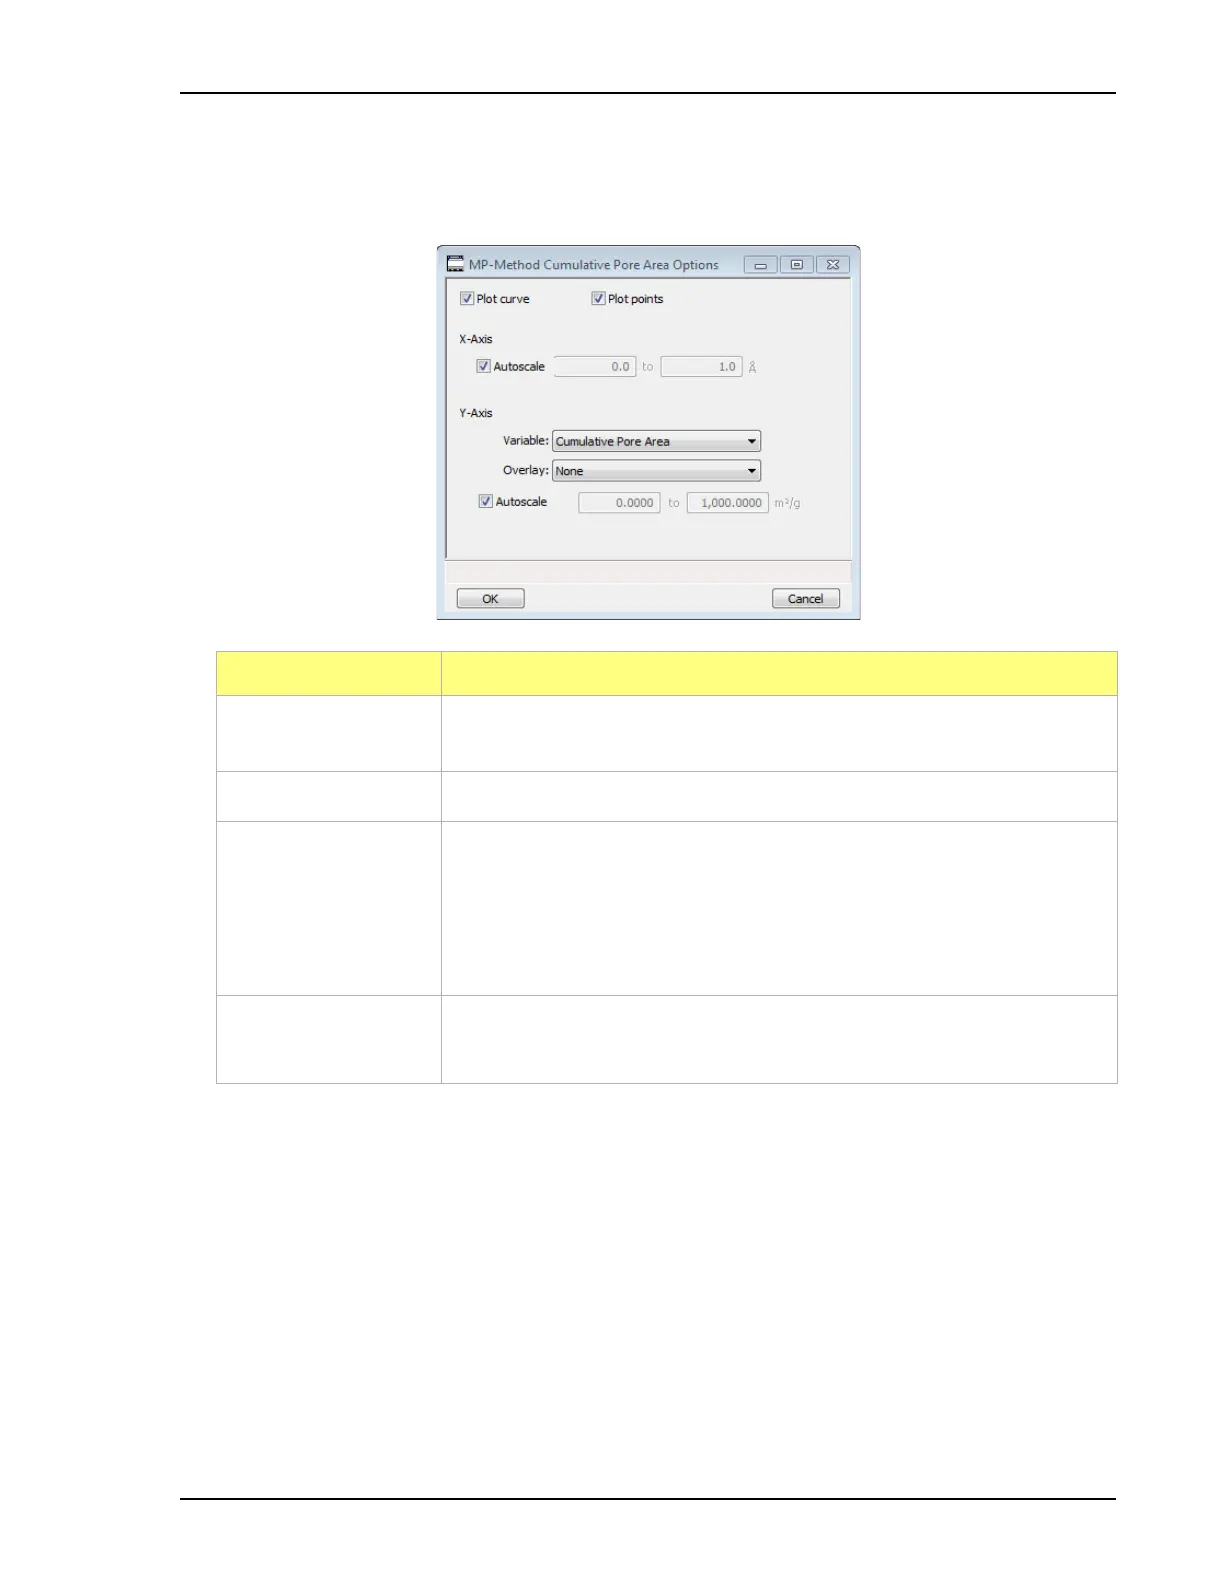
Plot curve / Plot points
checkboxes
Use to plot a curve and/or points.
X-Axis Use to have the x-axis autoscaled or enter beginning and ending values.
Y-Axis • Variable dropdown list - select a variable.
• Overlay dropdown list - select an option to overlay on the current
report.
• Autoscale checkbox - use to have the y-axis autoscaled or enter
beginning and ending values.
Cancel button
OK button
Refer to Common Fields and Buttons - File Menu Options, page 3-1.
 Loading...


