ASAP 2460 Operator’s Manual Working with Interactive Reports
246-42800-01 - Aug 2013 2-3
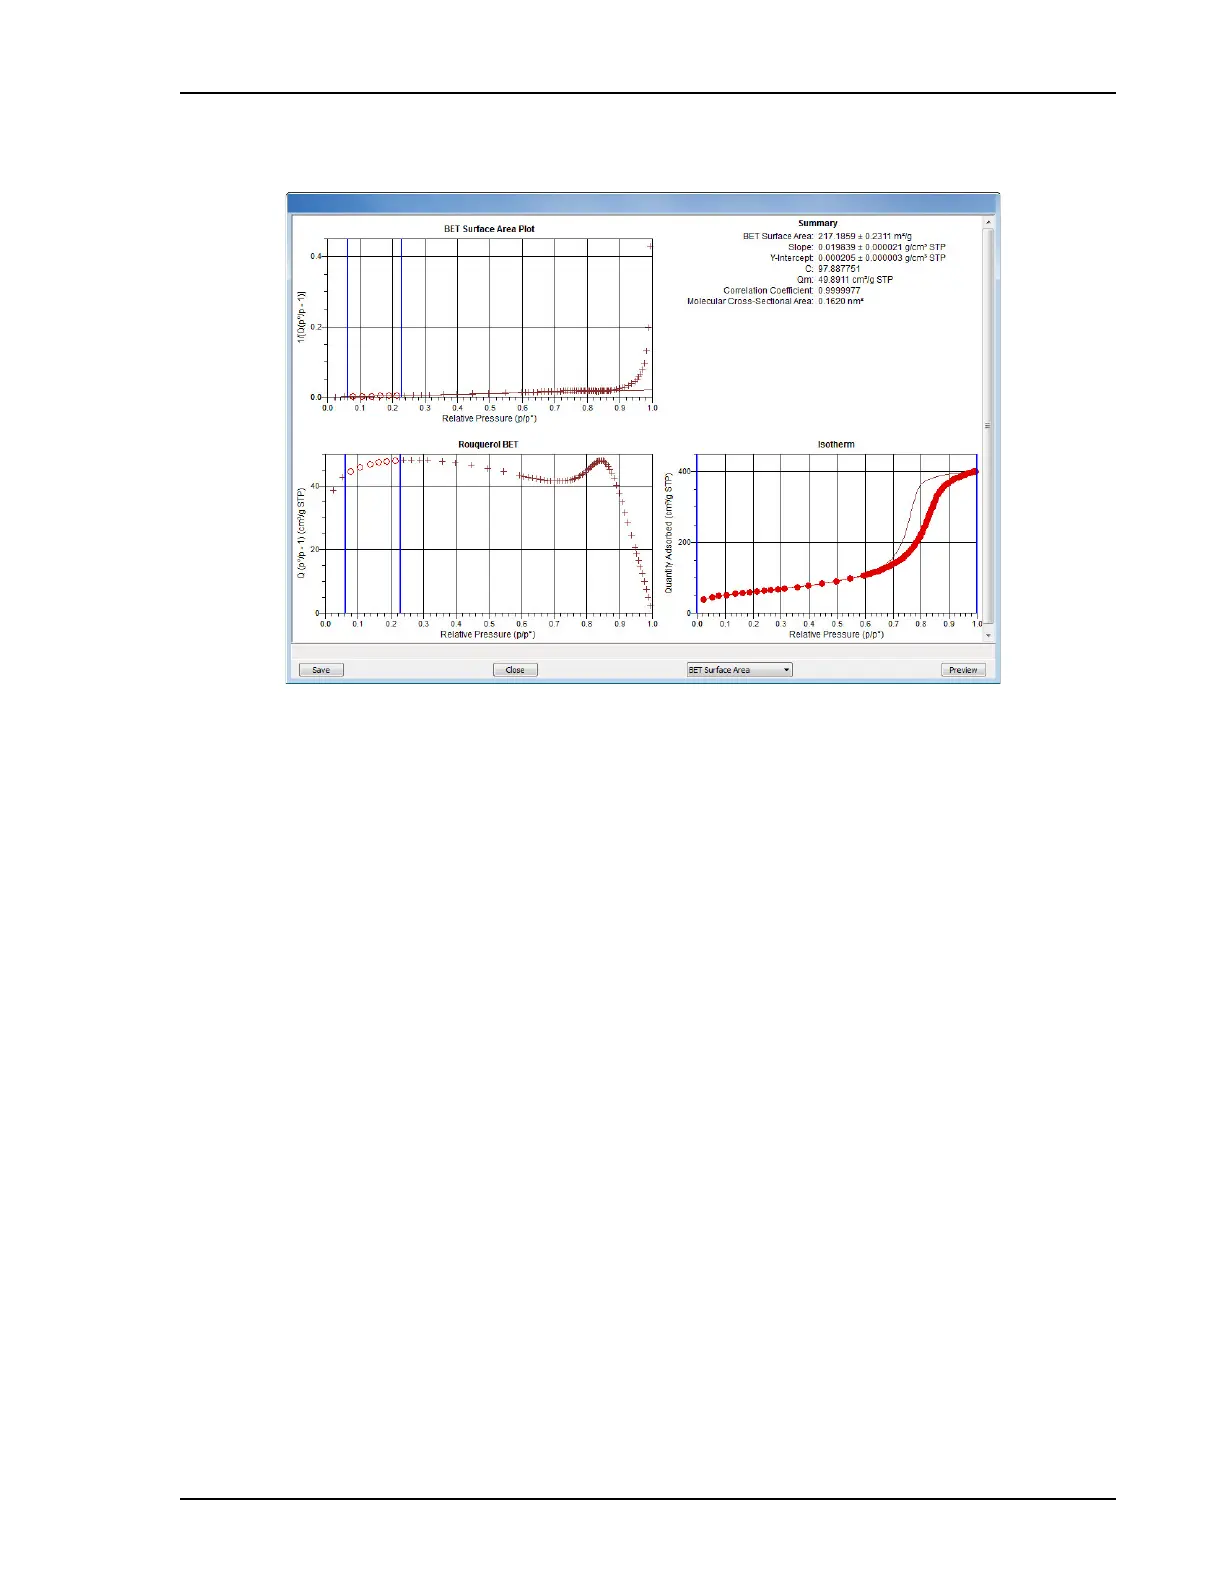
For example, if BET Surface Area is selected, a window similar to the following displays:
When data are edited, the changes are reflected immediately in the plots and the summary data
displayed in the window. Some editing options are:
• Drag the blue bars to increase or decrease the range of data included in the plot.
• Press CTRL, then left-click the mouse on a data point in the Isotherm Linear Plot to include or
omit the data point from the BET plot.
• Right-click the mouse to display a popup menu to include reports, enable or select overlays,
edit curves, axes, legends, titles, and copy and paste the data in a graph or in tabular format.
4. After editing the report, save the changes in the sample information file by clicking the Save
button.
 Loading...


