ASAP 2460 Operator’s Manual Generating Graph Overlays
246-42800-01 - Aug 2013 2-59
To import the ASCII text file to generate graph overlays:
The following steps use BJH Adsorption as an example. Screen appearance will vary depending on the
selected report.
1. Go to File > Open. Select a sample file to overlay graphs of other samples. To select more than
one file, hold down the Ctrl key on the keyboard while selecting the files, or hold down the Shift
key to select a range of files. Click Open.
If a file with a status other than Preparing, Prepared, or No Analysis is selected, the isotherm plot
displays. Select Advanced from the dropdown list at the bottom of the window to return to the
Sample Description window.
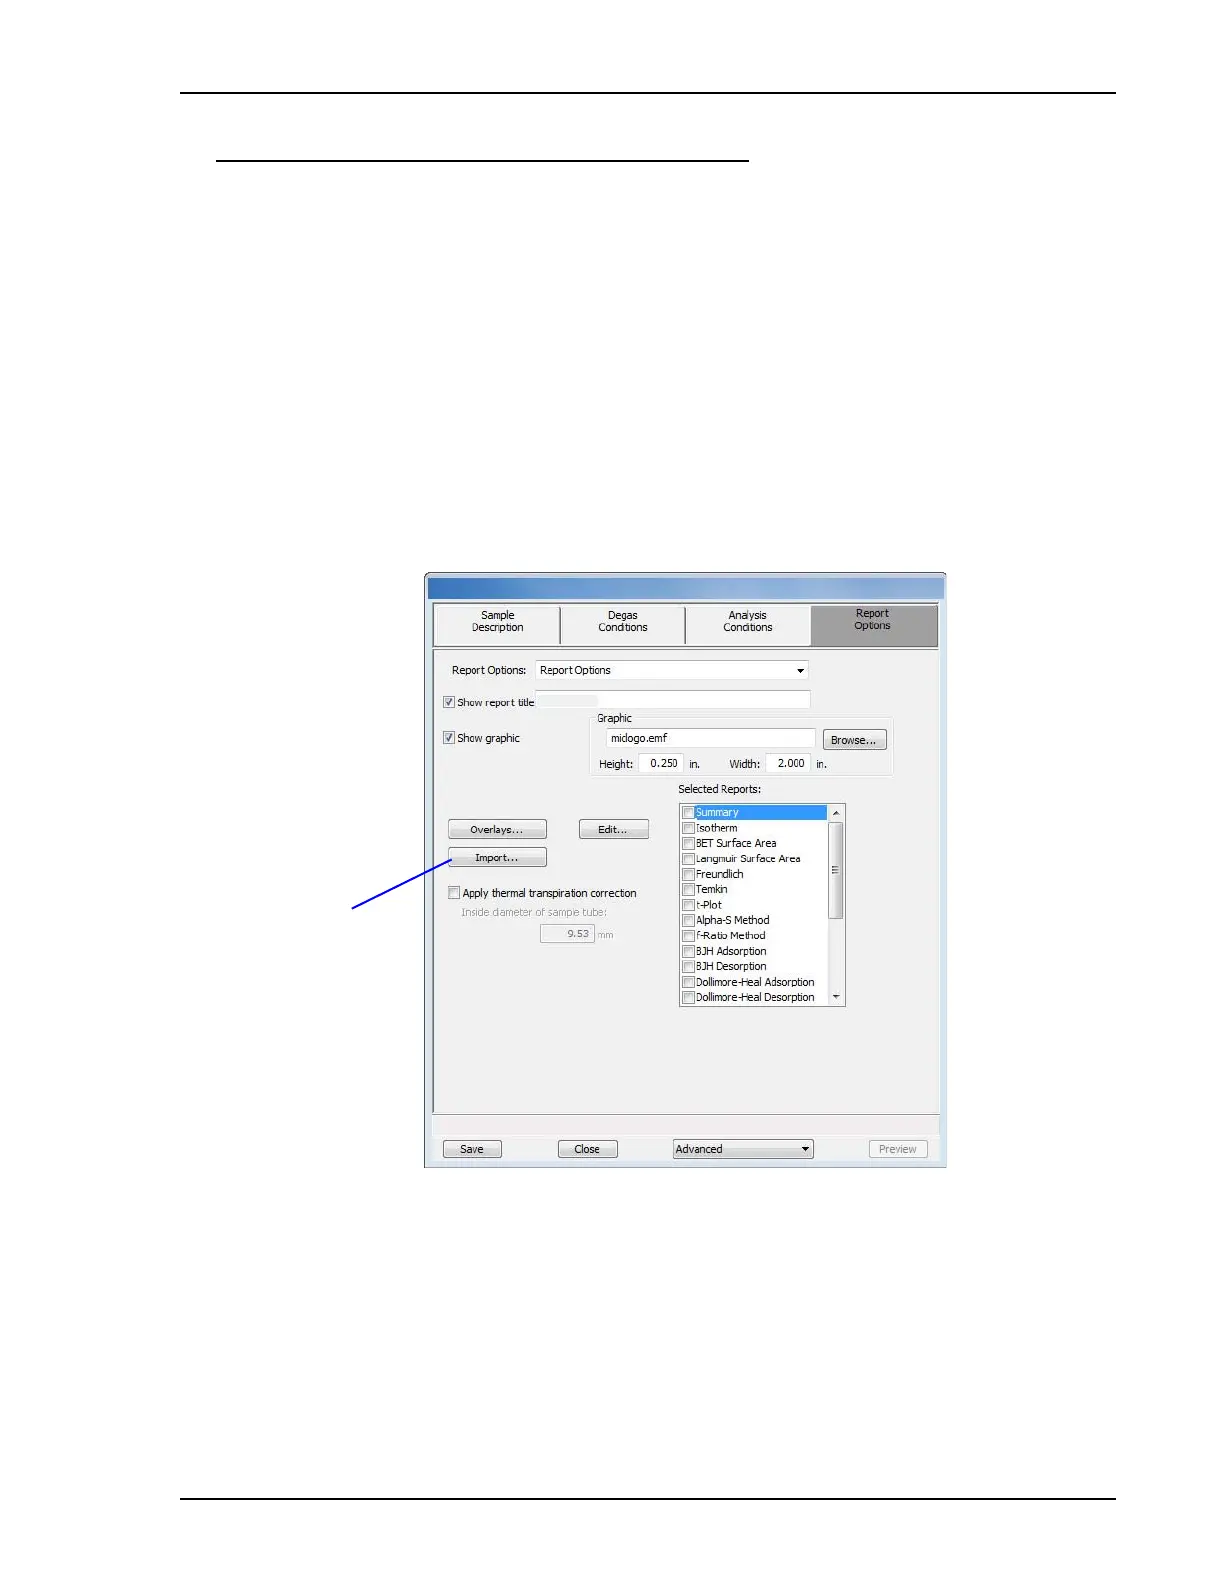
2. Click the Report Options tab.
a.) To import a .TXT file, click Import.
Click Import to import a
.TXT file for the overlay
 Loading...


