5-14 Qualitek mR Owner’s Guide
5.2.5.1 Dashboard Screen Elements
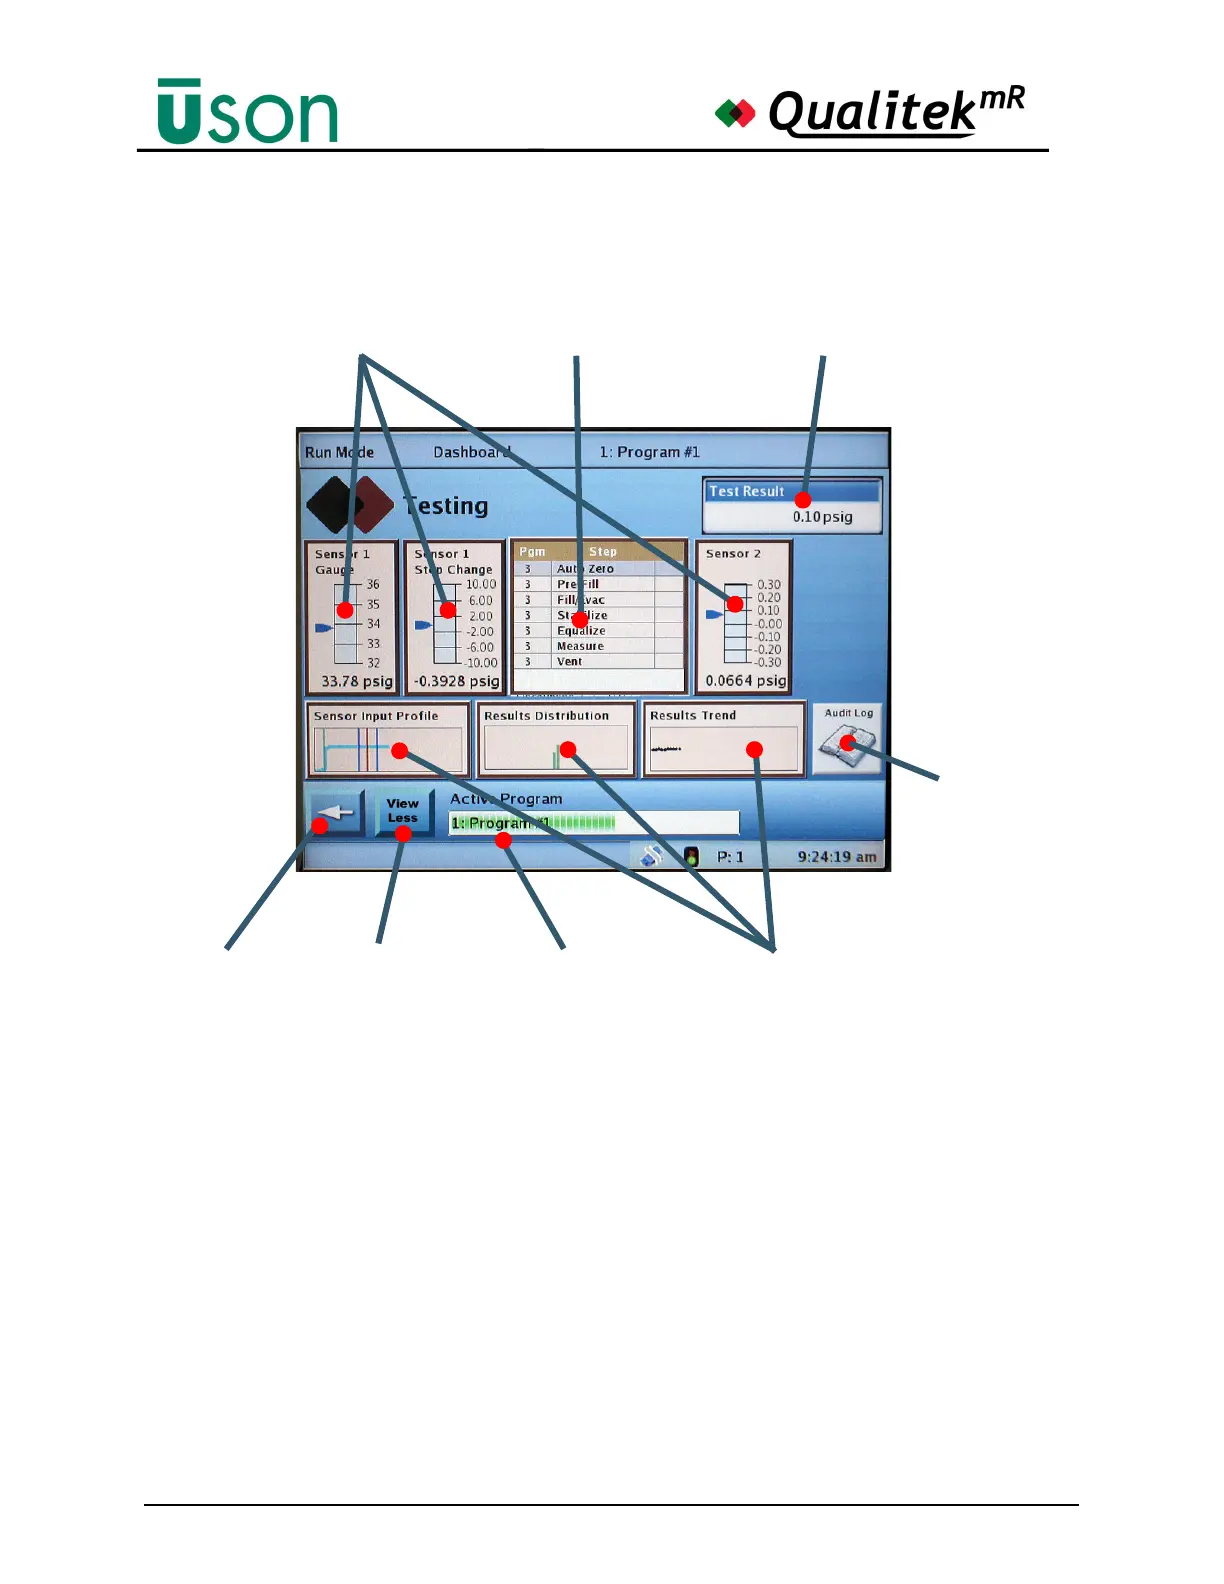
An illustration of the Dashboard screen in use while running a program is shown
below. Note that the gauges, graphs, and program bar are operating. in real-time.
Gauges
Vertical gauges show the real-time status of sensors in use. The gauge markings
may be customized.
Graphs
Profile graphs of sensor input, results distribution, and results trend are shown.
Tapping a graph will show the operator the full-sized profile, distribution, or trend
screen.
Details List
A condensed version of the Details display is shown in the middle of the screen.
Active Program Progress Indicator
The test progress is graphically shown as the rectangular bar at the bottom of the
dashboard screen expands from left to right.
Gauges Details List Results Data Bar
“Back” Button Active Program Progress
Indicator Bar
Graphs
View the
Audit Log
“View Less”
“View More”
Button