Run Mode 5-21
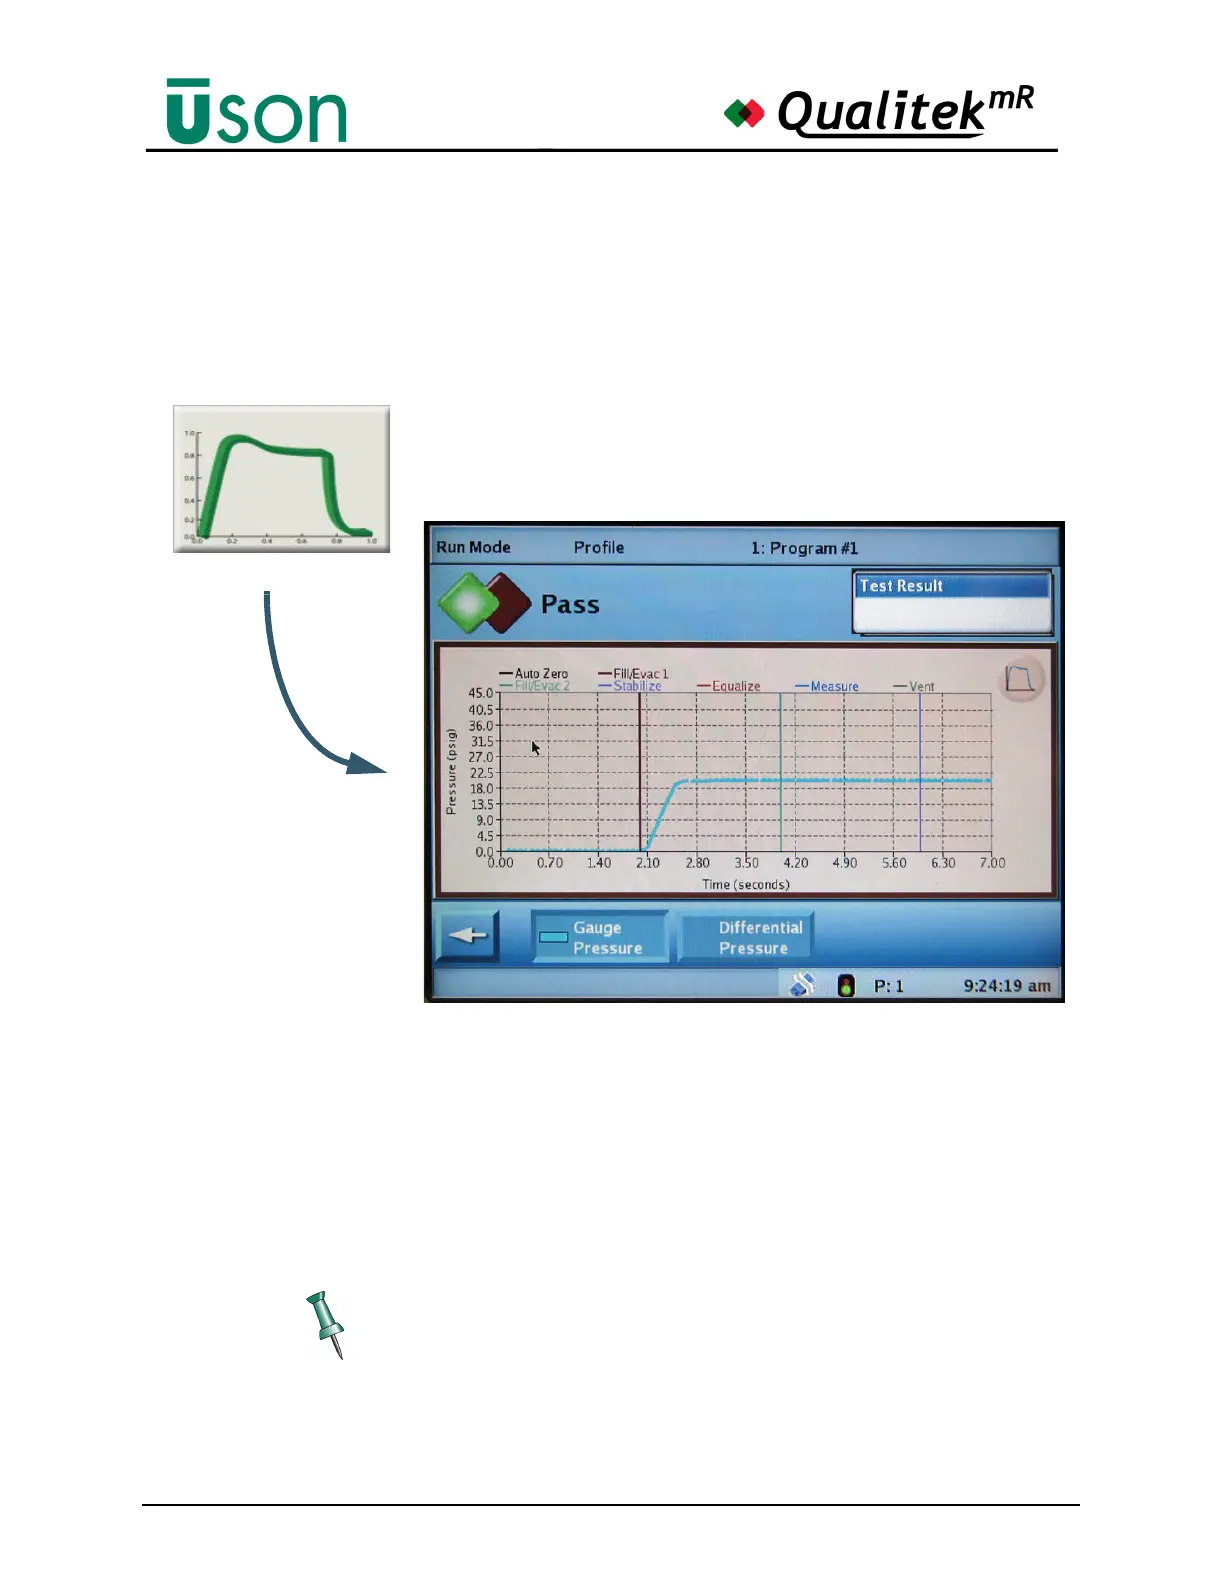
5.2.8 Profile
The Profile screen shows a plot of the current test referenced either to Gauge or
Differential pressure.
The Profile graph shown above and in the following illustration typical for Gauge
Pressure. Selecting the Differential Pressure button will make the y-axis move up
to the middle of the graph so that plus- and minus deviations from zero can be
graphed. The default values on the x- and y-axes are originally obtained from the
test setup but may be modified on the Profile Options screen. See "Profile Options
Screen" on page 5-23.
The graph can be touched and dragged to reposition it. Use the reset button in the
upper right corner to reset the axes to normal when desired.