5-26 Qualitek mR Owner’s Guide
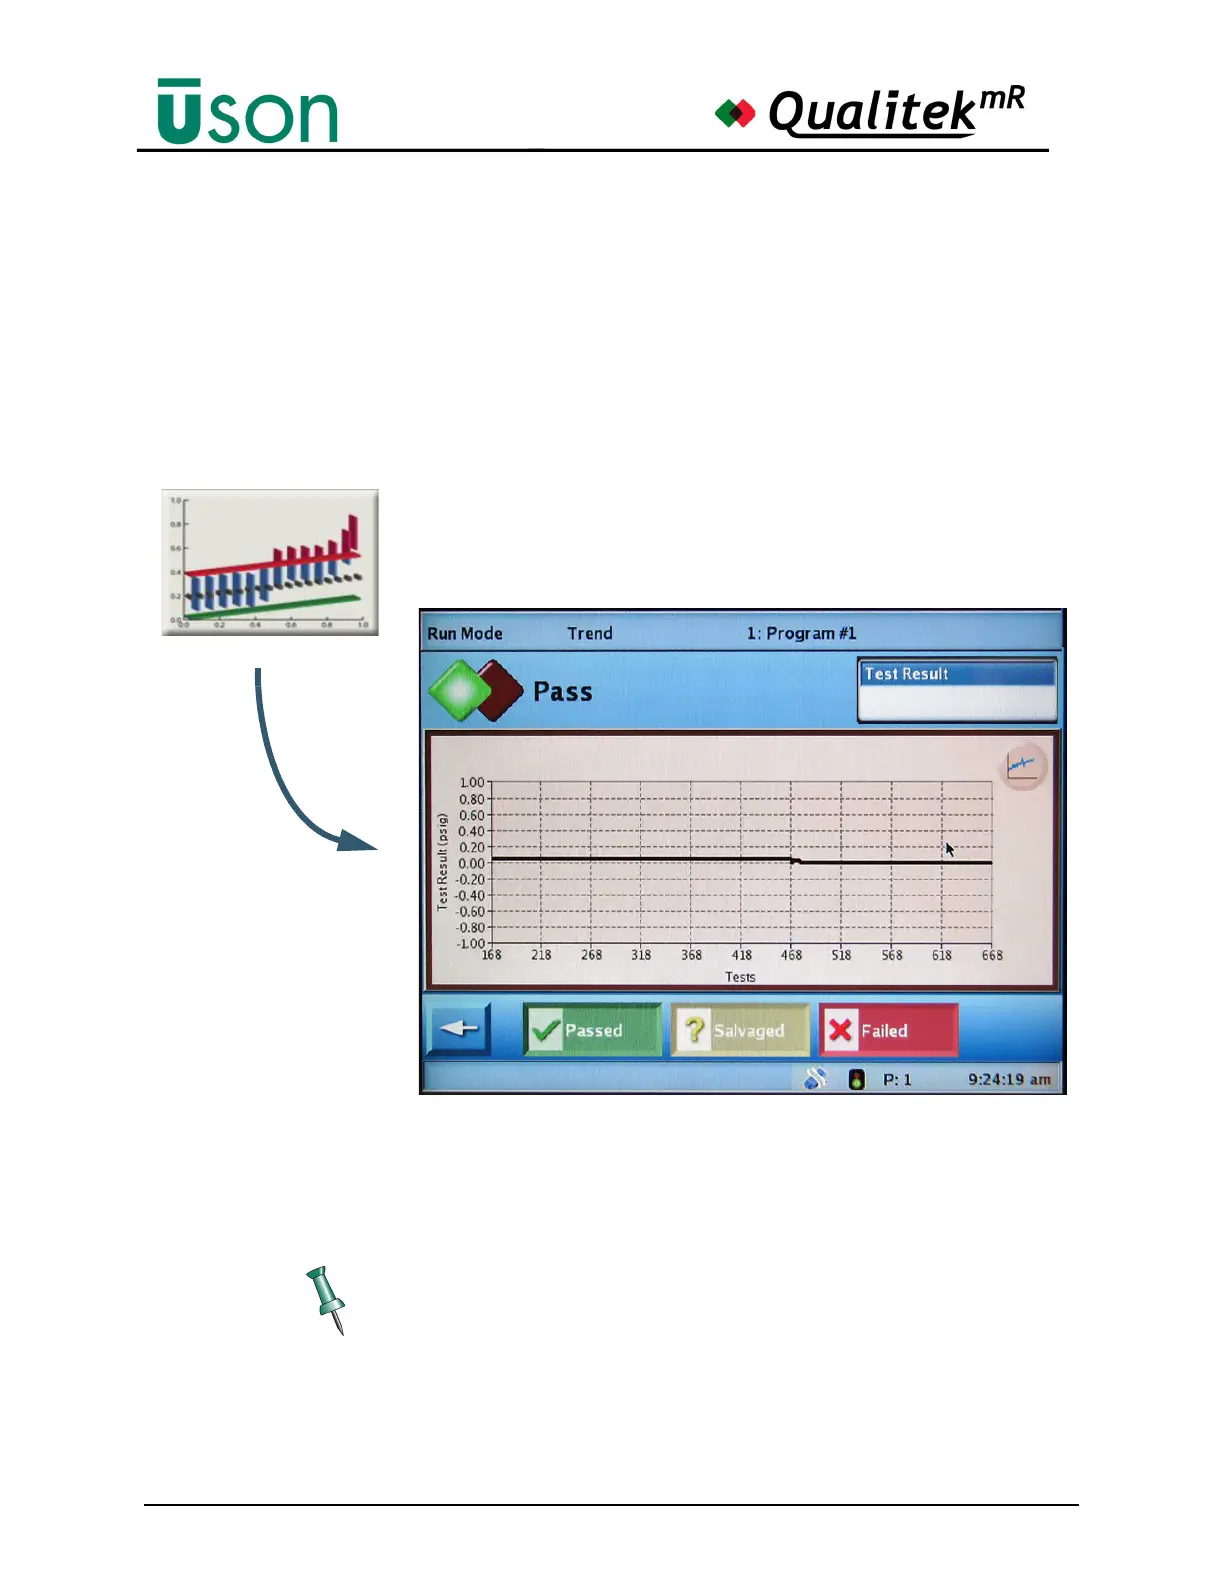
5.2.10 Trend
A trend plot of the test results is shown on the Trend screen.
Trend results are very important as they may indicate problems with the testing
strategy or product manufacturing process that might otherwise go unnoticed.
Trend results are most useful when many results have been collected from tests.
The more points collected, the better will be the representation of trends which
may develop over the course of a testing run.
The trend plot is a graph that shows the test results in the chosen units of measure
(y-axis) plotted against the number of tests (x-axis). The default values are
obtained from the test setup. There is one plot point for every test that has been
run.
The plot can be easily repositioned in the display area by touching the plot and
dragging it to a new position.