5-24 Qualitek mR Owner’s Guide
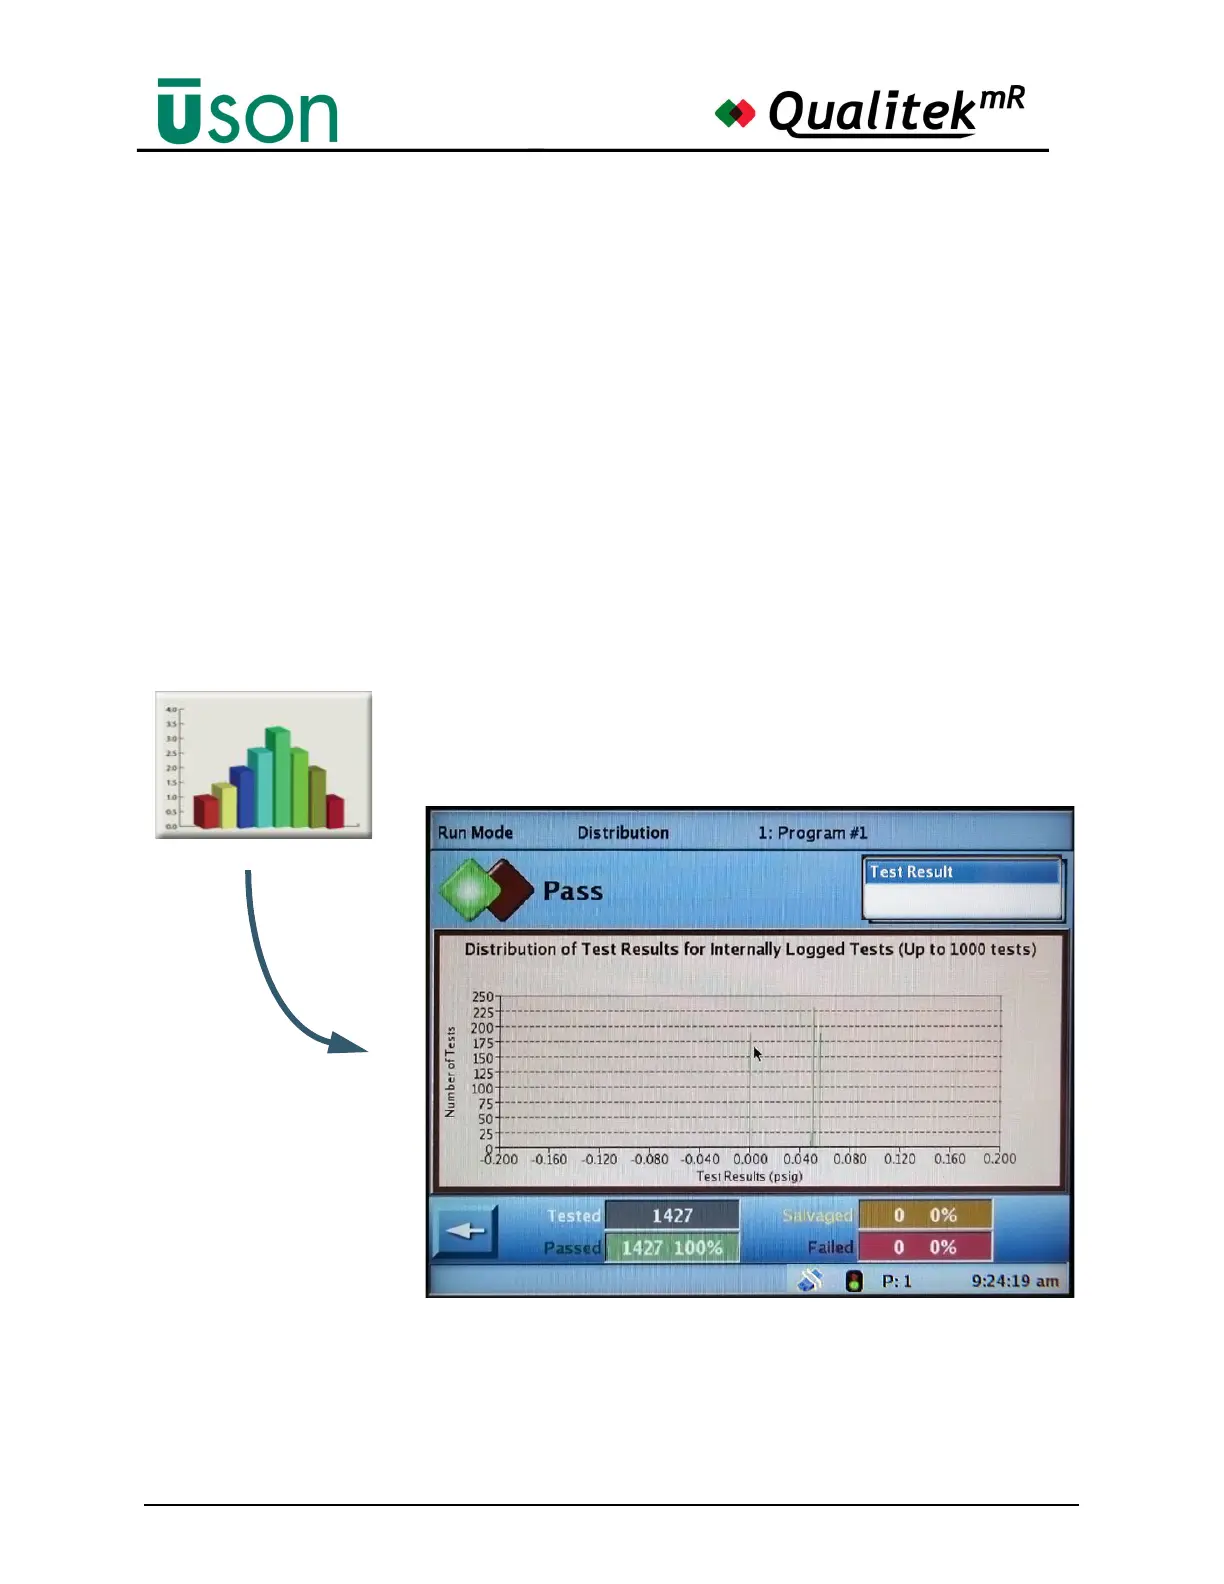
5.2.9 Distribution
A histogram of the testing activity is shown on the Distribution screen.
Test results are grouped into vertical bar plot objects called bins. The bins show the
groupings of the test results. The number of bins and the span of the results to
display can be adjusted, as desired. A running total of counts may be viewed in the
area below the graph. The following counts are displayed:
• Test Cycles
• Passed
• Salvaged
• Failed